


Bitcoin sharp sell-off last week left a historic mark on-chain. During the sudden collapse on February 5, investors locked in a total of $3.2 billion in realized losses. According to Glassnode and Checkonchain, this move now stands as the largest single capitulation event in Bitcoin’s history — as price fell from $70,000 to $60,000, on-chain behavior began flashing signals typically associated with bear market bottoms.
Price action reflected the severity of the move. On February 5, Bitcoin dropped rapidly from $70,000 to $60,000. The decline didn’t just impact spot markets; it fundamentally shifted on-chain dynamics. At the time of publication, BTC was trading near $67,600. On-chain data suggests price discovery remains active.
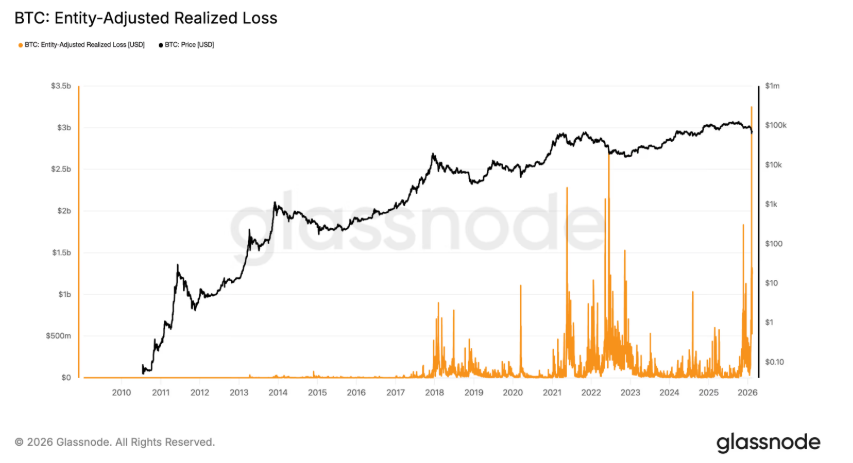
According to Glassnode, Asset-Based Realized Loss surged to $3.2 billion. This metric filters out internal transfers and tracks the dollar value of BTC sold below its acquisition price. In simple terms: it measures how much capital was actually lost during panic selling.
These levels now exceed even the darkest days of 2022, when realized losses peaked around $2.7 billion.
Daily Net Losses Surpass $1.5 Billion
On-chain data shared by Checkonchain shows the sell-off followed a textbook capitulation pattern.
According to the platform, last week’s Bitcoin liquidation wave unfolded rapidly, was backed by exceptionally high volume, and reflected position closures by the weakest hands — forming a classic capitulation structure.
With daily net realized losses exceeding $1.5 billion, this move represents the largest absolute USD loss event in Bitcoin’s network history.
Periods like this tend to be emotionally exhausting. Noise rises. Timelines darken. Patience thins. Yet on-chain behavior tells a more nuanced story: capitulations of this magnitude historically tend to appear near bear market bottoms.
Is Market Psychology Shifting?
A realized loss this large sends a clear technical signal: weak hands have largely been flushed from the market.
That doesn’t mean a definitive bottom is in. But historically, similar events are followed by declining volatility, sideways price action, and eventually a search for a new directional trend. Subtle changes matter. Transfer activity slows. Long-term wallets begin accumulating again. Open interest in derivatives starts to stabilize.
The picture is complex — but not one-dimensional.
Where Does Bitcoin Stand Now?
While dip-buying has pushed prices modestly higher, the market remains cautious. On-chain data suggests capitulation has largely played out. What typically follows is a transitional phase: low-volume consolidation, hesitant directional attempts, and gradually returning risk appetite.
You can also freely share your thoughts and comments about the topic in the comment section. Additionally, don’t forget to follow us on our Telegram, YouTube, and Twitter channels for the latest news and updates.