


Bitcoin is trading around $116,960 after reclaiming the $115,000 mark. Buyers remain in control despite ongoing consolidation below $120,000. Latest data shows the correlation between Bitcoin and the S&P 500 has surged to 80%. In this high-correlation phase, gains in U.S. equities tend to fuel Bitcoin’s momentum. On the other hand, stock market declines can trigger sharp volatility in crypto.
With the S&P 500 in an uptrend, Bitcoin appears to be following a similar path. However, analysts note that such elevated correlation levels rarely last long. Traders are watching both stock and crypto charts closely, aware that sudden shifts in risk appetite could quickly ripple into Bitcoin’s price.
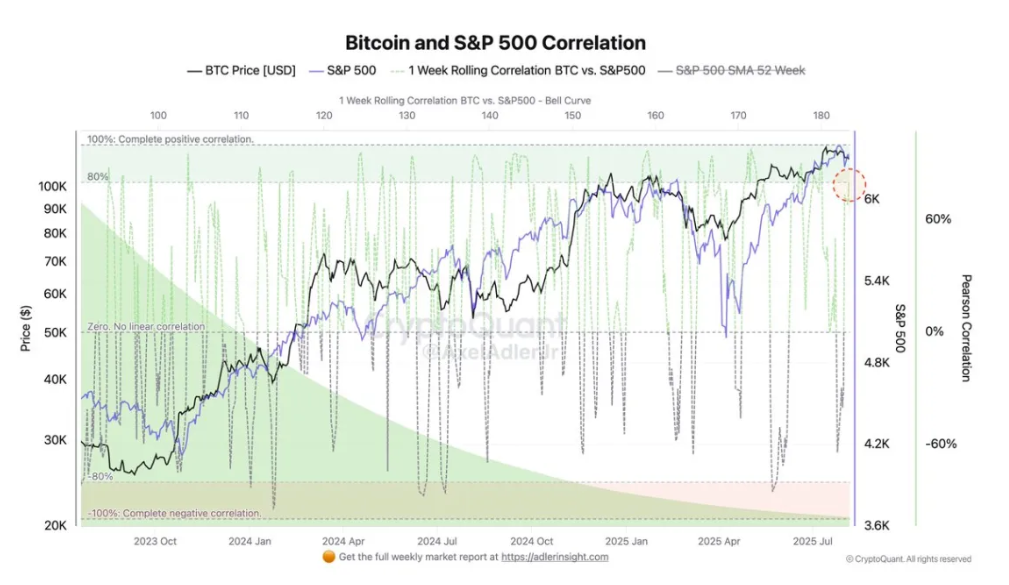
Macroeconomic Forces Shape Bitcoin’s Movement
Analyst Axel Adler highlights that the current 80% correlation reflects the strong influence of macroeconomic conditions on the crypto market. Interest rate expectations, liquidity trends, and overall risk sentiment are directly impacting BTC’s price. A sustained recovery in U.S. equities is providing a supportive backdrop for Bitcoin. Conversely, a downturn in stocks could swiftly spread negative sentiment across the crypto space.
Adler explains that the figure is based on a 1-week rolling correlation, which tends to be volatile. Historically, these spikes revert to the mean within weeks. Still, the expansion of institutional crypto products in the U.S. and corporate treasury allocations sets a constructive long-term picture.
Bitcoin Price Analysis: Key Support Holds Firm
Bitcoin has reclaimed the $115,724 horizontal support zone. On the 4-hour chart, the price has moved above the 50, 100, and 200-day SMAs. These levels, converging near $116,000, now form a strong support cluster. The immediate upside target remains the $122,077 resistance, last tested in mid-July. However, selling pressure around $117,000 has led to short-term consolidation.
Trading volume has eased after the breakout, signaling the need for fresh momentum. If support holds, BTC could attempt a move toward the $118,000–$122,000 range. If it fails, a retest of $115,724 and deeper pullback levels could follow.
You can also freely share your thoughts and comments about the topic in the comment section. Additionally, don’t forget to follow us on our Telegram, YouTube, and Twitter channels for the latest news and updates.