


Ethereum (ETH) has entered a period where both institutional and retail investor interest has reached its peak. Record-breaking U.S. spot ETF inflows, aggressive purchases by treasury companies, and rapid growth in on-chain activity have pushed the price to its highest level since December 2021. This strong fundamental outlook also supports a bullish scenario extending towards $6,800 on the technical side.
Historic Inflows in ETFs
According to SoSoValue data, U.S. spot Ethereum ETFs saw $326 million in inflows this week alone. Over the last 14 weeks, the total inflow has reached $9.8 billion.
- BlackRock’s ETHA ETF maintained its leadership with a total inflow of $9.85 billion, and its net assets stand at $12.35 billion.
- Grayscale’s ETHE ETF experienced $4.3 billion in outflows due to high management fees (2.50%), with its assets declining to $4.5 billion.
- Major funds such as Fidelity, Bitwise, and VanEck are also active in the market.
On the institutional buying side, Ethereum treasury companies stand out. SharpLink Gaming purchased 22,000 ETH this week, increasing its total holdings to $2.17 billion. BitMine and The Ether Machine hold $3.45 billion and $1.4 billion worth of ETH, respectively.
You may also be interested in: Peter Schiff: Even if Bitcoin Dominance Falls, My Preference is BTC!
DeFi and Stablecoin Dominance
The number of transactions on the Ethereum network has increased by 52% to over 47 million in the last 30 days. During the same period, transaction fees reached $48 million.
The total value locked (TVL) in the DeFi ecosystem stands at $195 billion, with bridge assets totaling $501 billion. Stablecoin supply has reached $137 billion, solidifying Ethereum’s leadership in the DeFi and stablecoin markets. With the implementation of the GENIUS Act in the United States, this dominance is expected to grow further.
Golden Cross and Inverse Head-and-Shoulders
In the three-day chart, ETH price has strongly recovered from the $1,392 low seen in April. The 50-day moving average crossing above the 200-day moving average has formed a golden cross pattern, which is generally considered an early signal of long-term bullish trends.
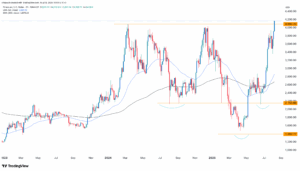
The chart also clearly shows an inverse head-and-shoulders pattern with a neckline at $4,090. The target measurement of the pattern, adding the $2,700 difference between the head and the neckline to the neckline level, points to a target price of $6,800. This target represents approximately a 68% potential increase from current levels.
For the latest cryptocurrency news, click here