


Recent on-chain data shows a noticeable rise in Bitcoin whale selling, yet analysts caution against interpreting this trend as a sign of panic. According to Glassnode, the current wave of large-holder activity mirrors the natural profit-taking behavior typically observed during the later stages of a market cycle. Rather than signaling deep structural weakness, the pattern reflects a maturing phase in Bitcoin’s ongoing bullish trend.
Whale Activity and Market Dynamics
This week, a notable whale transaction drew attention after 2,400 BTC was transferred to Kraken, suggesting potential selling pressure. Data from Arkham indicates that this movement aligns with a broader uptick in whale outflows over recent weeks.
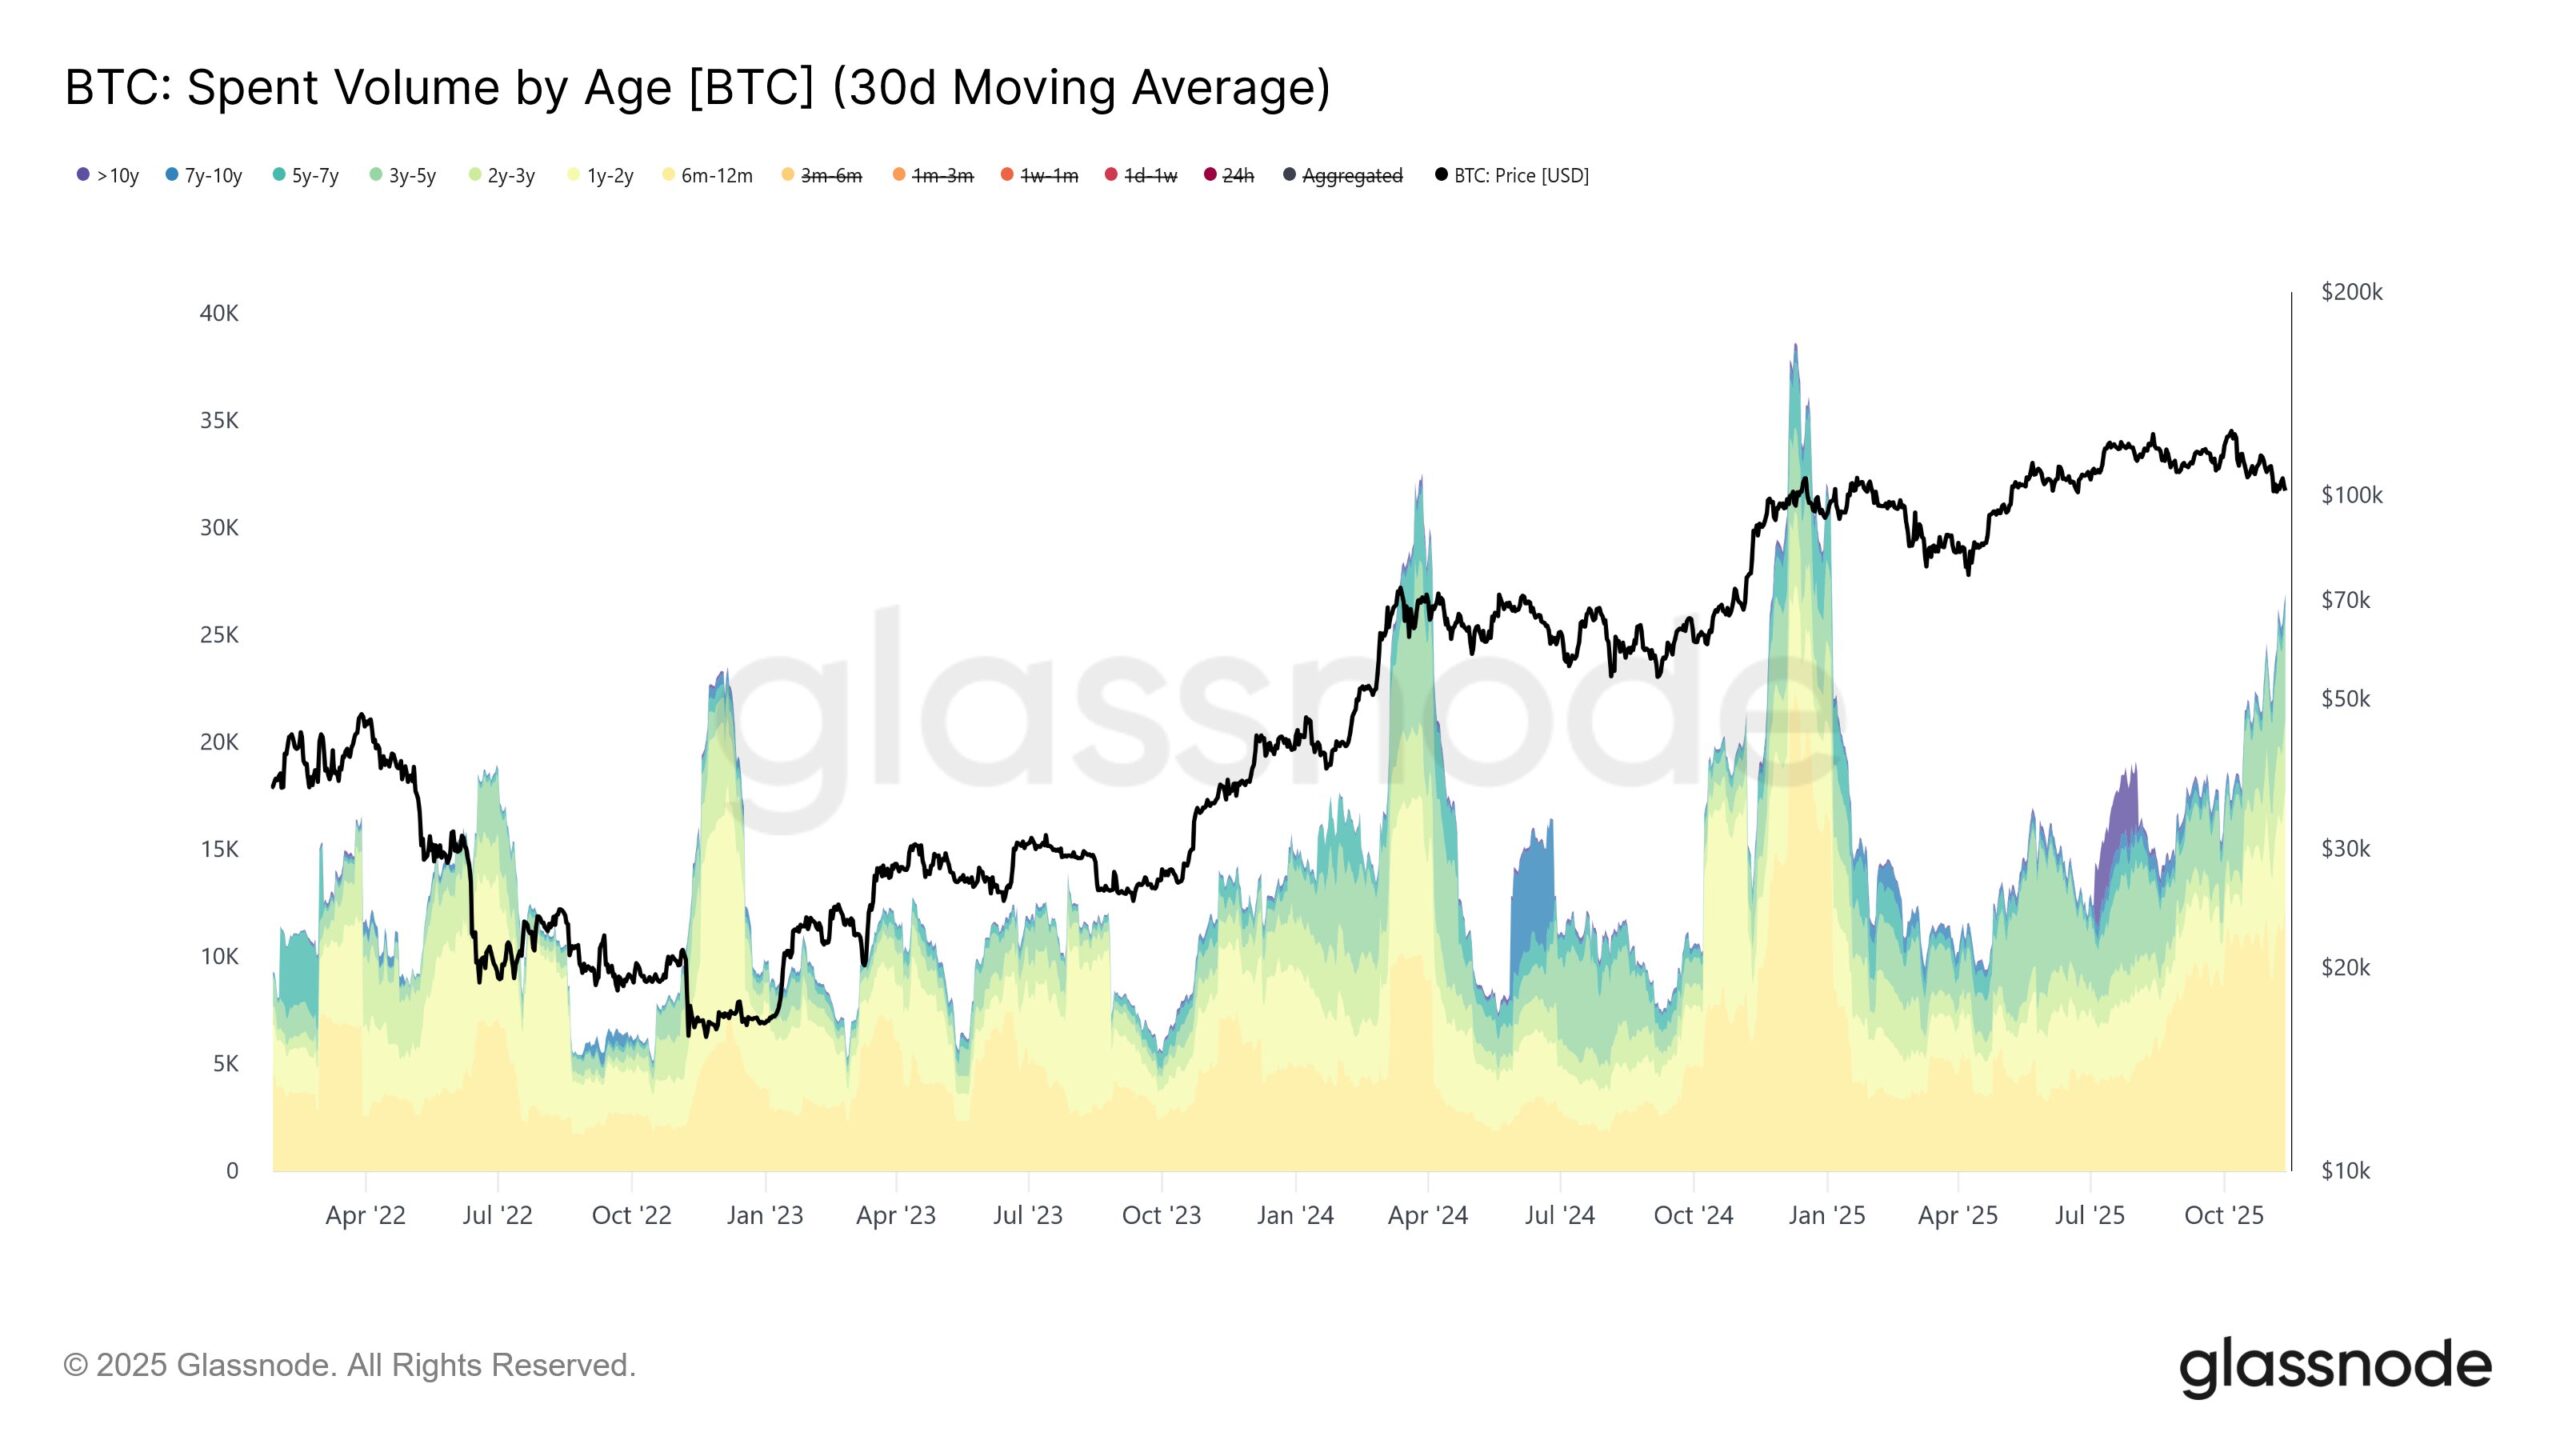
Glassnode analysts emphasize that these actions should not be misunderstood as “OG whales dumping.” Their metrics show that the monthly average spent by long-term holders has climbed from around 12,000 BTC per day in early July to nearly 26,000 BTC as of this week. Such a shift points to a steady, structured distribution pattern. According to Glassnode, this is not panic-driven selling but rather a normal phase of late-cycle profit realization.
Is Bitcoin Approaching a Market Top?
Vincent Liu, Chief Investment Officer at Kronos Research, argues that whale selling today reflects organized capital rotation rather than distress. In his view, cooling momentum does not necessarily imply that Bitcoin has hit a peak. As long as market liquidity remains resilient and fresh buyers continue to absorb supply, the uptrend could remain intact.
Liu also notes that Bitcoin’s net unrealized profit ratio, currently around 0.476, may indicate that a short-term bottom is taking shape. However, he warns that this metric alone cannot confirm a definitive reversal.
Historical Patterns and Structural Shifts
Charlie Sherry of BTC Markets adds that whale selling typically gains significance only when accompanied by weak buy-side support — a factor that may be relevant in the current environment. Even so, he believes it is too soon to determine whether the market has truly reached a cycle top.
Historically, Bitcoin peaks have occurred roughly four years apart. The highs of 2017 and 2021 support this pattern, and the most recent all-time high on October 6, 2025 — emerging 1,050 days after the previous bottom — fits within this timeline. Still, Sherry cautions against relying too heavily on this model. With the rise of ETFs, institutional involvement, and shifting global liquidity conditions, Bitcoin’s traditional four-year rhythm may be evolving.
You can also freely share your thoughts and comments about the topic in the comment section. Additionally, don’t forget to follow us on our Telegram, YouTube, and Twitter channels for the latest news and updates.