


Ustd dominance in the crypto market is represented as usdt.d, showing investors and users this specific metric directly. Usdt.d is one of the leading indicators that displays where liquidity is flowing in the crypto market, what the current risk perception is, and whether sentiment is shifting. Investors often look at this metric to detect major market reversals, such as whether a bull or bear trend is approaching. As of November 2025, usdt.d attracted significant attention and showed unexpected movements. This move is not seen merely as a number by investors. As the saying goes, “the writing is on the wall”—and that describes the situation perfectly. The visible signals can be categorized as follows:
- Investor confidence is decreasing.
- Market psychology is shifting.
- Capital flows are turning negative.
Following these negative developments, it would not be wrong to say that potential market maps may be redrawn.
What is Usdt.d?
Think of all the stablecoins in the crypto market. Among them are USDT, USDC, USDE, and many others. This is exactly where usdt.d comes into play. The total amount of USDT circulating in the market, relative to the overall crypto market capitalization, gives us this metric. In short, it shows what percentage of investors’ funds currently sit in USDT.
Why Is USDT Dominance Important?
As mentioned earlier, usdt.d helps us follow certain strategic pathways. When this ratio increases, it indicates that investors are moving out of risky assets and into USDT as a “safe haven.” When this shift occurs, we see that market participants are favoring stablecoins.
In this article, you may also want to check out: The Critical Ethereum Update Date Is Approaching!
What Is Happening in November 2025?
As of November 2025, the long-standing 6% usdt.d resistance, unbroken since 2022, has finally been breached. This 6% zone was the top of a declining trend, and if momentum continues here, we could move toward another major breakout.
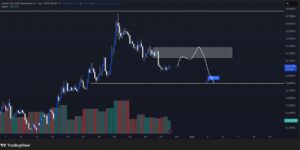
After giving an internal structural breakout and then moving sideways, usdt.d appears likely to retest the highlighted zone. If a pullback occurs to this level and it fails to close above 6.28%, we expect the downward movement to continue toward the 5.81% region. Investors without existing positions or those looking for new opportunities may consider entering positions if the price approaches the 6.28% level.
For the latest breaking crypto news, click here.