


Recent volatility Bitcoin has revived an old question: just how far can the current correction extend? While some market commentators warn that BTC could revisit the $35,000 range, others argue that such a dramatic decline is neither likely nor technically supported. New analysis based on historical behavior and key indicators points toward a shallower downside.
Why a Drop to $35,000 May Be Unrealistic
Sharp corrections are nothing new for Bitcoin. During the previous cycle, BTC plunged from its $69,000 peak in late 2021 to around $15,500 the following year, marking a drawdown of roughly 77%. However, according to analyst “Sykodelic,” the structure of the current cycle does not resemble that period.
The analyst explains that major retracements typically follow exceptionally strong expansion phases, which can be measured through indicators such as the relative strength index (RSI). In this cycle, Bitcoin never reached the kind of overheated momentum that preceded previous deep contractions. Because of this, a 70%–75% decline appears inconsistent with present market conditions.
At the moment, BTC is down about 31% from its October high near $126,000—an entirely ordinary pullback during a broader uptrend.
Bollinger Bands Signal a Higher Market Floor
A key element of the bullish argument comes from long-term Bollinger Band analysis. Historically, Bitcoin has never closed below the lower band on the monthly timeframe. Even during the intense volatility of 2017, BTC did not break beneath this level.
Based on this pattern, Sykodelic argues that even in a severe downturn, the downside may be limited. If the monthly candle slips under the midline, the analyst identifies $55,000 as the most extreme potential bottom.
Analysts Expect a Shallower Correction
Other experts take an even milder view. Jeff Ko, chief analyst at CoinEx, believes a move to $55,000 is unlikely, citing structural changes in the market. With deeper liquidity, ETF involvement, and broader institutional participation, Ko argues that the old 70%–80% drawdowns are no longer a reasonable expectation. His bearish scenario sees Bitcoin retesting only the $65,000–$68,000 region.
The Critical Support Zone to Watch
Still, not all observers are optimistic. Augustine Fan of SignalPlus warns that losing the support band around $72,000–$75,000 could trigger significant stop-loss cascades and unpredictable market stress due to leveraged positions.
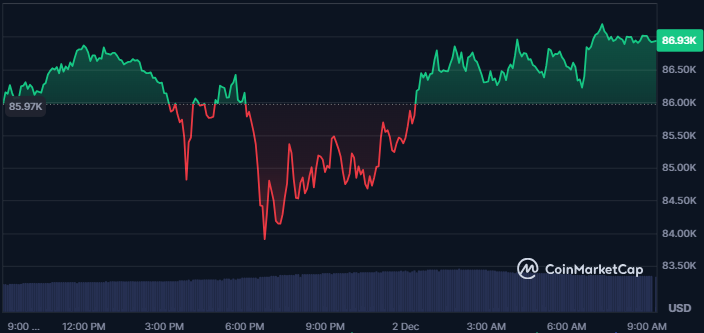
At the time of writing, Bitcoin is trading near $87,000, having partially recovered from a brief dip toward $84,000 earlier in the week. While opinions differ on how low BTC might fall, many analysts agree that today’s market structure is fundamentally stronger than in previous cycles—potentially setting the stage for a more controlled correction rather than a catastrophic capitulation.
You can also freely share your thoughts and comments about the topic in the comment section. Additionally, don’t forget to follow us on our Telegram, YouTube, and Twitter channels for the latest news and updates.