


Uncertainty has once again taken center stage in the crypto markets, prompting renewed debate over Bitcoin (BTC)’s position in the current market cycle. A combination of on-chain indicators and long-term technical signals suggests that Bitcoin may already be in the early stages of a bear market. In particular, metrics designed to capture broader market behavior are beginning to point toward a sustained shift in trend.
What Long-Term Indicators Are Signaling
Several composite indicators used to assess Bitcoin’s overall market health evaluate variables such as network usage, investor profitability, demand dynamics, and liquidity conditions. A notable portion of these indicators began to weaken in early November and have yet to show meaningful recovery. This persistence is often interpreted as a sign that downside pressure is becoming structural rather than temporary.
From a technical standpoint, one of the most widely followed confirmations of a bear market is Bitcoin’s move below its one-year moving average. This indicator reflects the average price over the past 12 months and is commonly used to identify long-term trends. When Bitcoin trades below this level for an extended period, it is frequently viewed as confirmation that bullish momentum has broken down.
Bitcoin’s 2025 Price Performance
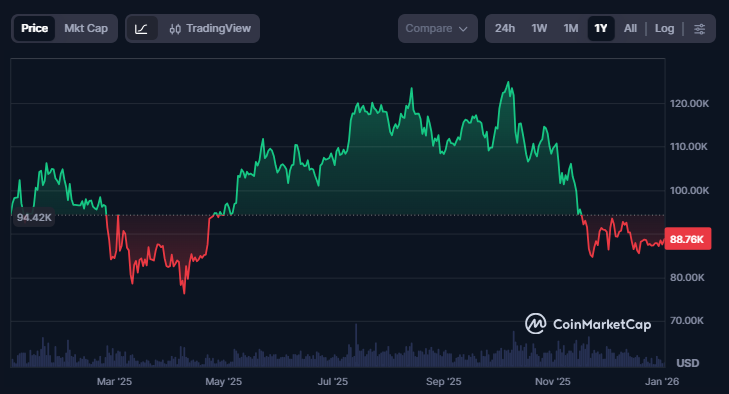
Bitcoin entered 2025 trading near the $93,000 level and experienced a strong rally in the first part of the year. This advance culminated in a peak of $126,080 in October. However, prices failed to hold those levels, and Bitcoin ultimately declined to finish the year below where it began. This sequence — a sharp peak followed by sustained weakness — has reinforced concerns that the broader trend has shifted.
Potential Bear Market Bottom: $56,000–$60,000
Historical bear markets in crypto have often followed a similar pattern: after significant excess during bull phases, prices tend to retrace toward the realized price. This level represents the average cost basis of Bitcoin holders and has frequently acted as a long-term support zone during market downturns.
Based on prior cycles and current valuation metrics, a potential bottom in the range of $56,000 to $60,000 is considered plausible over the coming period. This would align with historical behavior observed during previous bear markets.
Why This Bear Market May Be Different
A decline to the $56,000 level would represent roughly a 55% drawdown from Bitcoin’s all-time high. While substantial, this would still be notably milder than the 70–80% declines seen in earlier cycles. Additionally, the absence of major systemic failures or high-profile collapses suggests a more orderly market environment.
Another key difference lies in market structure. Institutional participation, ETF-related demand, and a broader base of long-term investors have introduced more consistent buying behavior. Unlike previous bear markets, where demand largely vanished, current conditions suggest a more resilient and mature ecosystem. These structural changes may ultimately limit downside volatility and support long-term stability for Bitcoin.
You can also freely share your thoughts and comments about the topic in the comment section. Additionally, don’t forget to follow us on our Telegram, YouTube, and Twitter channels for the latest news and updates.