


Bitcoin has lost more than 22% of its value recently, sparking renewed debate about where the bear market might bottom out. Analysts are referencing Fibonacci levels, historical cycles, and on-chain data to identify potential support zones. Meanwhile, some commentators argue that structural changes and increased institutional participation make it increasingly unlikely for Bitcoin to drop below $50,000.
Bitcoin has dropped 22.5% over the past month, briefly hitting its lowest levels in over a year before rebounding. This move has intensified discussions around market cycles, technical indicators, and on-chain signals. Amid rising uncertainty, many analysts are now focusing on key price areas below $40,000.
What Do Historical Cycles and Fibonacci Suggest?
On February 6, Bitcoin fell to $60,000 before rebounding to $70,354. 10x Research emphasized that although market sentiment and technical indicators were approaching extreme levels, the overall downward trend continues. Historical bear markets show that Bitcoin tends to follow certain mathematical ratios.
Analyst Ardi examined Fibonacci retracement levels linked to past cycle lows. Bitcoin bottomed at the 78.6% Fibonacci level during the 2022 bear market, currently around $39,176. Analyst Nehal highlighted historical drops: 93% in 2011, 86% in 2015, 84% in 2018, and 77% in 2022. Applying this model to the current cycle suggests a potential bottom around $38,000.
On-chain data also provides insights. Analyst Ted Pillows noted that when prices fall roughly 15% below the average cost for long-term holders, cycle lows typically occur. With the realized price around $40,300, this model suggests a potential bottom near $34,500—though Pillows personally doubts it will drop that low.
On-Chain Signals and the $50,000 Threshold
Some analysts believe Bitcoin’s bottom may already have formed, making a deeper bear market less likely. One analyst noted that past cycle bottoms often occurred just below all-time highs.
Spot Bitcoin ETFs and growing institutional involvement are cited as factors that make drops below $50,000 increasingly unlikely:
“Volatility and sharp pullbacks can happen. But structurally, falling below $50,000 would require a breakdown. Institutional infrastructure and large capital are unlikely to allow this.”
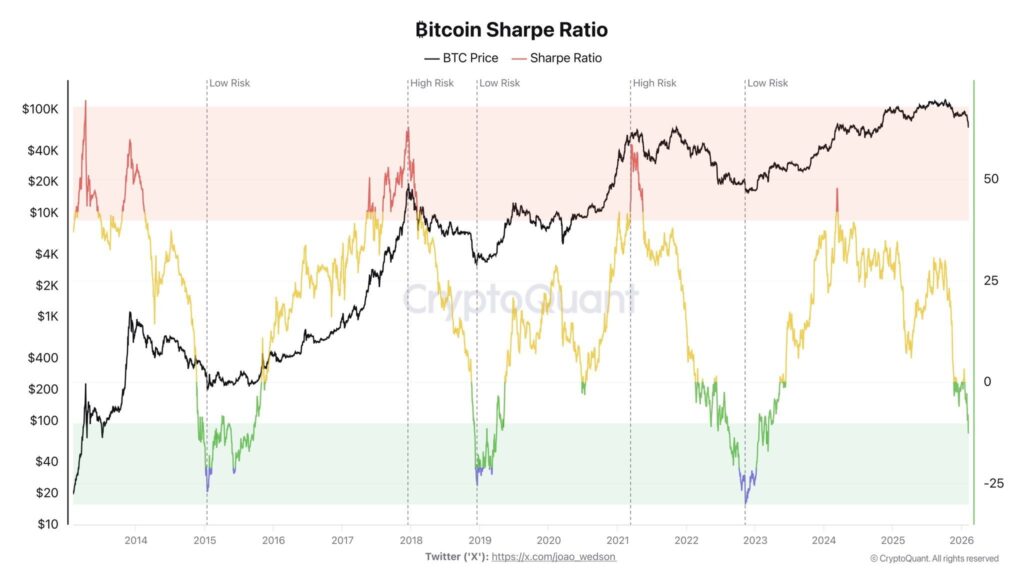
Analyst Darkfost added that Bitcoin’s Sharpe ratio has reached levels historically associated with the final stages of bear markets. While this signals potential market reversal zones, it does not necessarily indicate the end of the bear market. Prices could drop further over the next few months, with intermittent rallies along the way, as the risk-reward profile becomes increasingly extreme.
Technical Outlook and Support Levels
Our Coinmühendisi analyst noted that Bitcoin is in a downtrend across all timeframes, with a weekly close below $74,000 confirming a bearish bias. The next major support level is expected around $52,500, and retracements toward this zone should be considered normal.
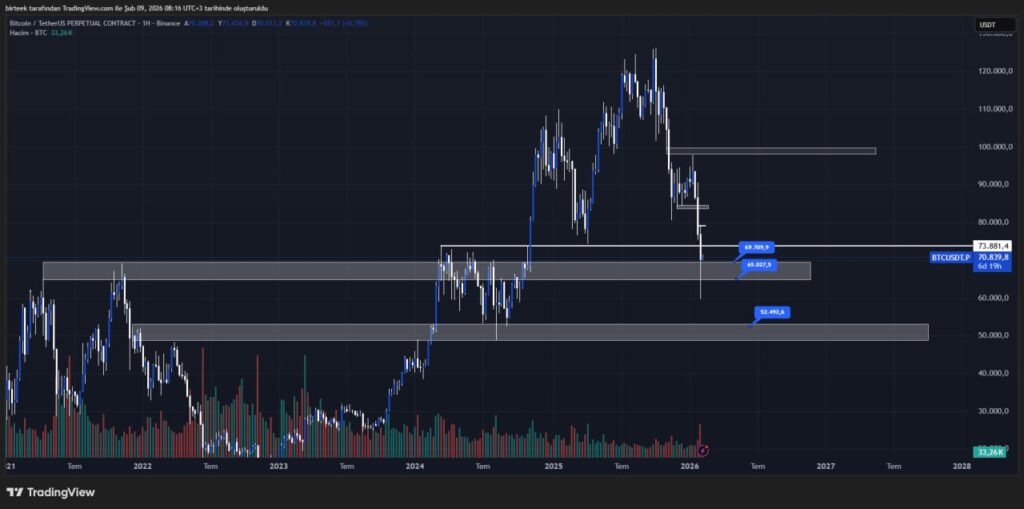
The analyst also highlighted the possibility of market manipulation. Following the weekly confirmation, some traders may continue short positions. However, a break above this level could trigger upward momentum. Short-term rallies are inevitable, but weekly confirmation and trend structure should not be ignored.
You can also freely share your thoughts and comments about the topic in the comment section. Additionally, don’t forget to follow us on our Telegram, YouTube, and Twitter channels for the latest news and updates.