


Ethereum experienced its latest decline due to weak derivatives market data, rising ETH supply, and slowing onchain activity. Although price briefly climbed above $2,150, traders’ risk appetite remains low, and a confirmed bottom signal has yet to emerge.
ETH lost 43% in just nine days before bottoming at $1,750 on Friday. A subsequent relief bounce lifted prices roughly 22%, pushing ETH back into the $2,100 range. The rebound in Bitcoin and US equities provided temporary breathing room for crypto, but cautious sentiment in derivatives markets continues to dominate.
Derivatives Markets Are Still Not Convinced
Ethereum monthly futures traded at only a 3% premium over spot markets on Monday. In healthy bullish conditions, this spread is typically expected to exceed 5%.
This muted premium has remained largely unchanged for nearly a month. Even as price approached $1,800, there was no meaningful increase in risk appetite among derivatives traders.
In short: bulls have not fully stepped onto the field.
On the macro side, growing uncertainty around the US labor market and lingering questions over the sustainability of AI infrastructure investments are weighing on risk sentiment. As a result, building strong upside momentum for ETH in the short term appears difficult.
Ethereum Is Lagging — Yet Still Leading
Ethereum has underperformed total crypto market capitalization by roughly 9% throughout 2026. Naturally, this raises a key question: why is capital rotating away from ETH?
Declining interest in decentralized applications is not unique to Ethereum. Still, when layer-2 solutions are included, the network remains the clear leader in total value locked (TVL) and fee generation.
Deposits on Ethereum’s base layer account for 58% of the entire blockchain industry. That figure rises above 65% when Base, Arbitrum, and Optimism are added.
For comparison: the largest application on Solana barely exceeds $2 billion in TVL. Meanwhile, the biggest DApp on Ethereum’s base layer holds over $23 billion. Solana’s Jupiter wouldn’t even rank in Ethereum’s top 14. Usage-wise, Ethereum remains dominant — but price is not reflecting that reality.
The Real Pressure: Supply Growth and Layer-2 Debate
Over the past 30 days, Ethereum’s base layer generated roughly $19 million in network fees, while the layer-2 ecosystem contributed another $14.6 million. Despite this, the network faces criticism for heavily subsidizing scalability through optimistic rollups.
Buterin stated that layer-2 solutions have taken a more difficult path than expected, noting that current bridges are largely controlled by multisig setups — a structure that doesn’t align well with Ethereum’s original vision. This has raised fresh concerns about network security and long-term direction.
According to Buterin, the decentralization journey of layer 2 has proven more complex than anticipated. Most existing bridges rely on multisig control, which clashes with Ethereum’s foundational security principles.
Layer-2 solutions are not disappearing. Demand for privacy-focused or application-specific networks is likely to persist. Still, today’s structure is failing to reassure investors.
Another critical issue is ETH supply. The narrative of Ethereum becoming deflationary has weakened as network activity slowed. The burn mechanism depends on base-layer data usage — when activity declines, ETH supply starts rising again.
Over the past 30 days, annualized ETH inflation reached 0.8%. A year ago, this figure was close to zero. It may seem minor, but it significantly impacts long-term investor psychology.
Technical Outlook Remains Weak
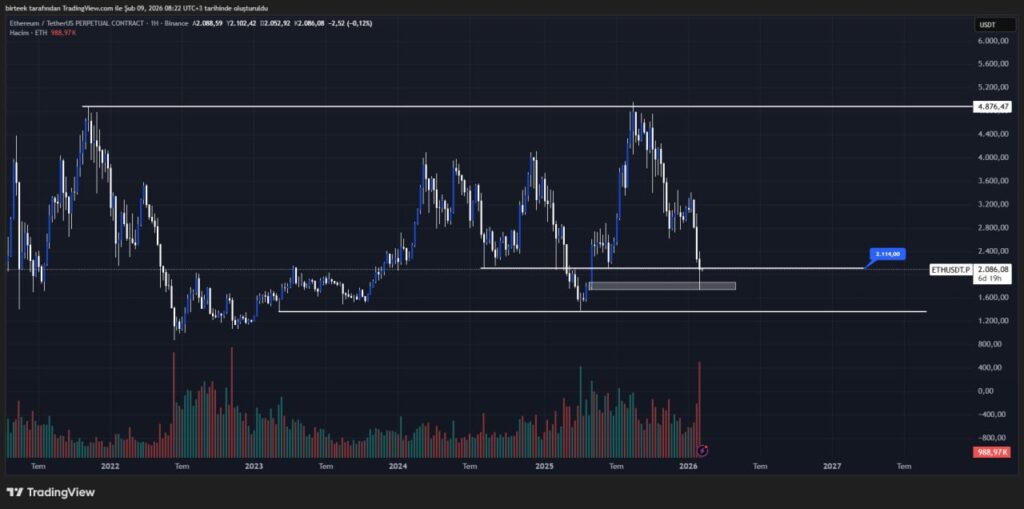
Short-term technical conditions are also far from encouraging. After losing the $2,114 support level, Ethereum has maintained a bearish structure. Last week, price pulled back into a daily support zone and bounced, but failing to close the week within that area weakened the bullish case.
For now, the major support zone sits around $1,365. Liquidity has accumulated heavily at this level, and market participants believe price may attempt to sweep it.
Previous uptrends also began with reactions from this region. In summary: Ethereum’s primary direction remains downward. Without a pullback toward $1,365, the odds of a strong and sustainable recovery look slim.
Has the Bottom Arrived?
Ethereum prices may have rebounded. Markets appear temporarily relieved.
But when derivatives data, onchain activity, and macro uncertainty are combined, it’s hard to confirm a definitive bottom. What we’re seeing for now looks more like a relief rally.
A lasting trend reversal will likely require more time.
You can also freely share your thoughts and comments about the topic in the comment section. Additionally, don’t forget to follow us on our Telegram, YouTube, and Twitter channels for the latest news and updates.