


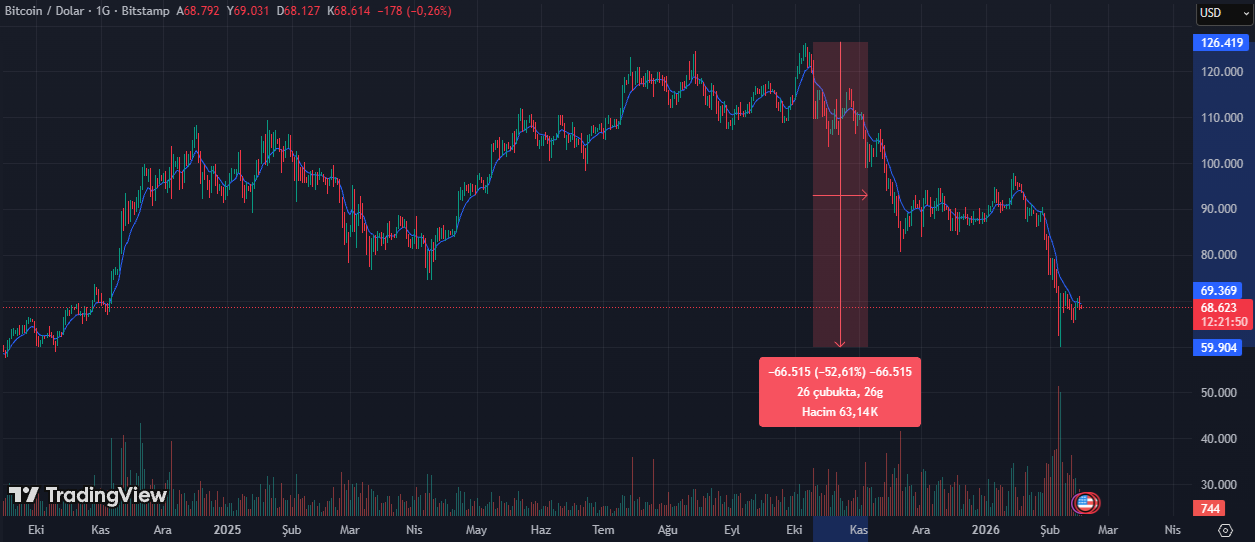
As of February 2026, the cryptocurrency market has once again entered a period of heightened volatility. After reaching an all-time high of approximately $126,198 in October 2025, Bitcoin began a significant corrective phase. The current price structure has reignited discussions among investors about whether a new “crypto winter” could be unfolding.
With the second half of the month approaching, understanding the underlying market dynamics has become increasingly important. Recent price action has been shaped by large-scale deleveraging, tighter macroeconomic conditions, and the fading momentum that followed the surge of interest in Bitcoin ETFs last year.
Bitcoin Outlook: Orderly Deleveraging or Bear Market?
In early February, Bitcoin dropped below the psychological $70,000 level, briefly testing the $61,000 area. Unlike the disorderly crashes seen in previous cycles, this decline appears more controlled. Futures open interest fell by more than 20% within a short period, signaling that excessive speculative leverage has been flushed out of the system.
Rather than pointing to structural collapse, this development suggests a market undergoing recalibration. The unwinding of leveraged positions may represent a normalization process after the aggressive rally that led to the 2025 peak.
Key Drivers Shaping Bitcoin February Performance
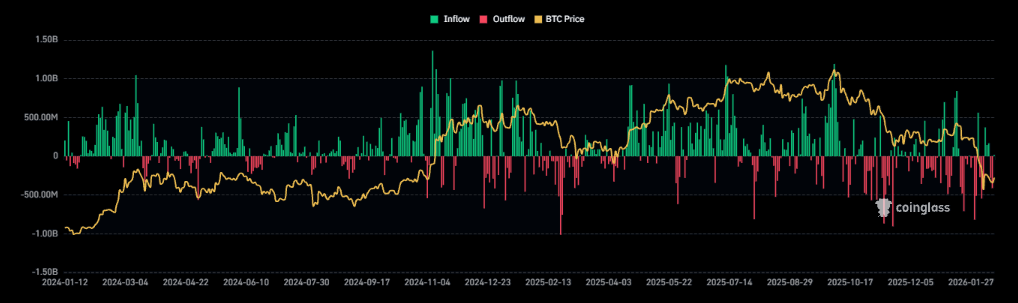
Institutional Outflows: Recent data shows that outflows from Bitcoin and Ethereum ETFs have started to exceed inflows. This trend indicates that some institutional investors are taking profits or reallocating capital toward more defensive assets.
Macroeconomic Pressure: The Federal Reserve has maintained policy rates near 3.75%, while inflation remains around 2.4%. The persistence of relatively tight monetary conditions continues to limit appetite for higher-risk assets, including cryptocurrencies.
Tax Season Impact: The introduction of the IRS Form 1099-DA for the 2026 tax year has added compliance complexity, particularly for U.S.-based investors. As a result, some market participants may be reducing exposure to meet potential tax obligations.
Critical Technical Levels
The following price zones are likely to define Bitcoin’s trajectory into the end of February:
-
Major Resistance: $84,117
-
Near-Term Resistance: $72,390
-
Immediate Support: $65,000
-
Strong Support: $58,950
Market consensus suggests Bitcoin may consolidate within the $64,000–$75,000 range for the remainder of the month. A recovery above $100,000 before month-end is widely considered unlikely.
The Cyclical Correction Pattern
Historically, Bitcoin has tended to peak 12 to 18 months after a halving event. The October 2025 high occurred roughly 17 months after the 2024 halving, and the subsequent 40–50% correction aligns with patterns observed in previous cycles.
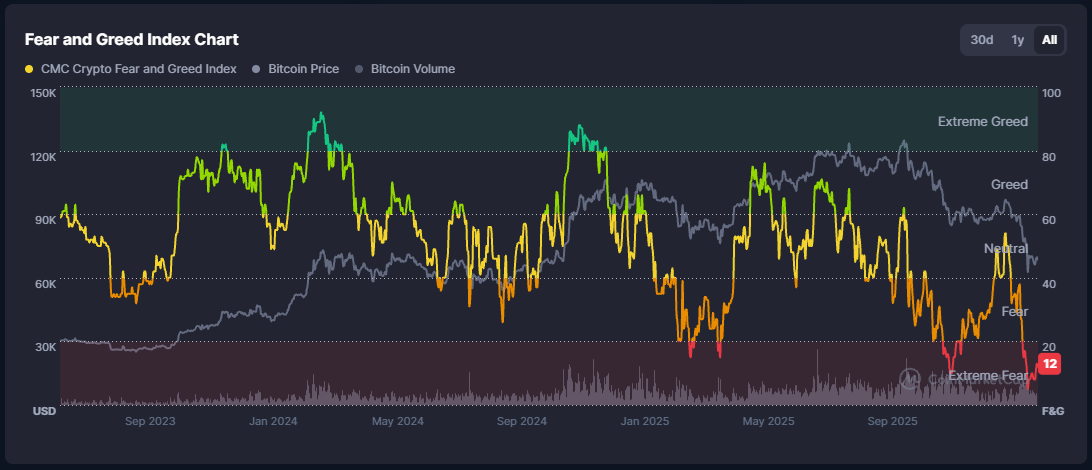
With the Fear and Greed Index currently in extreme fear territory (around 0–20), some experienced investors interpret the environment as a reset phase rather than a terminal decline.
Additionally, continued progress in Layer 2 infrastructure and institutional custody solutions suggests that the market’s structural foundation is stronger than in prior downturns.
This content is not investment advice.
You can also freely share your thoughts and comments about the topic in the comment section. Additionally, don’t forget to follow us on our Telegram, YouTube, and Twitter channels for the latest news and updates.