


Bitcoin dropped to $64,290 earlier this week and is currently holding around $65,400. Interestingly, while the price fell, Polymarket forecasts still indicate $75,000. Here lies a clear contradiction: charts and on-chain data show weakening momentum, yet the prediction market remains heavily positioned for an upward scenario.
Fear Index at Historic Lows
The Crypto Fear and Greed Index dropped to 5/100, signaling “extreme fear.” This level has only been seen three times since 2018: August 2019, June 2022, and early February 2026. Panic is present, but so is potential opportunity.
Over the weekend, Bitcoin reached $68,600 but is now stuck near the bottom of its range. According to CoinGlass, over 136,000 traders were liquidated in the last 24 hours, totaling $458 million, with 92% coming from leveraged long positions. This highlights that short-term risk appetite remains limited.
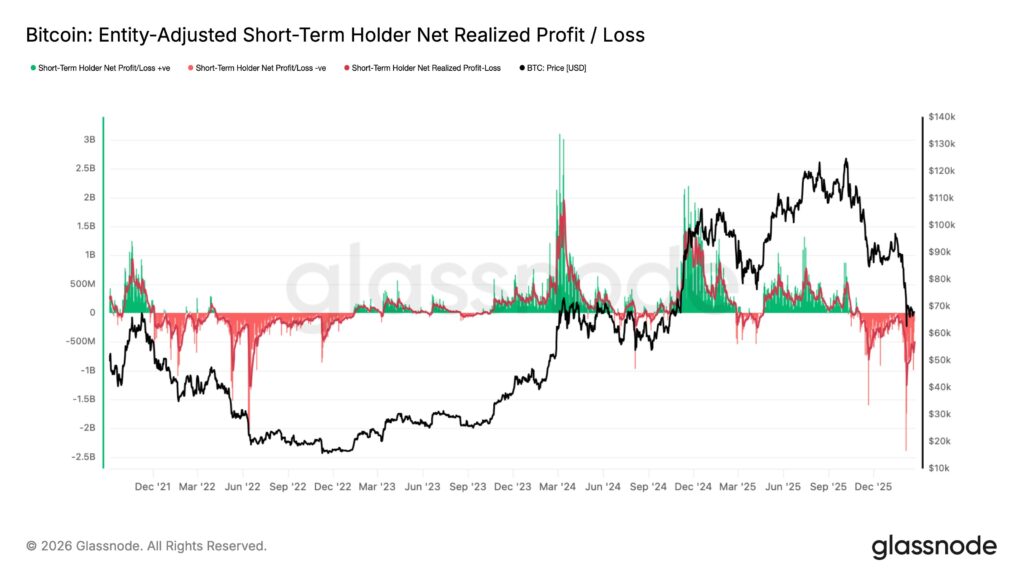
Weekly Realized Losses
Glassnode reports show that investors who bought Bitcoin at the beginning of February were experiencing roughly $1.24 billion in daily losses. This figure has now fallen to $480 million, meaning new investors are still enduring significant daily losses. Panic has eased but bottoming processes continue. Short-term traders are still selling at a loss, which is typical during consolidation periods rather than during strong uptrends.
Whales and On-Chain Dynamics
Large whales holding 100,000–1,000,000 BTC accumulated roughly 13,460 BTC, a cautious buy signal.
Mid-size whales with 10,000–100,000 BTC sold about 10,000 BTC in the same period.
CryptoQuant data shows that nearly two-thirds of all BTC moving to exchanges comes from the top 10 wallets, with an all-time high exchange whale ratio of 0.64. Average daily deposits on altcoin exchanges rose to around 49,000 in 2026, up from 40,000 in Q4 2025—aligning with higher volatility and lower risk appetite.
Stablecoin inflows have sharply contracted: from a one-year peak of $616 million in November to just $27 million currently. This indicates limited short-term buying power.
Why Is Bitcoin Falling?
The recent drop is not only technical; macro risks play a major role. Tensions along the Washington–Tehran line are rising, while Trump’s tariff decisions add uncertainty. The critical 48-hour period in Geneva appears to have pushed investors away from risky assets, increasing demand for gold and silver. Meanwhile, Trump’s decision to raise tariffs to 15% caused expectations of global supply chain disruption. Despite a weakening dollar, Bitcoin remains pressured; Nasdaq is down 0.9%, and stablecoin inflows are historically low. Technical support is intact, but macro risks continue to weigh on the price.
Technical Support and Resistance
Bitcoin’s $65,000 support level is now a critical pivot. The 72,600–73,200 resistance zone contains approximately 149,000 BTC. As the price approaches, investors at breakeven may close positions. Whale accumulation might not fully absorb this supply.
Beyond technicals, psychological resistance matters as well. If $72,000 is not breached, selling pressure may continue, limiting upward attempts.
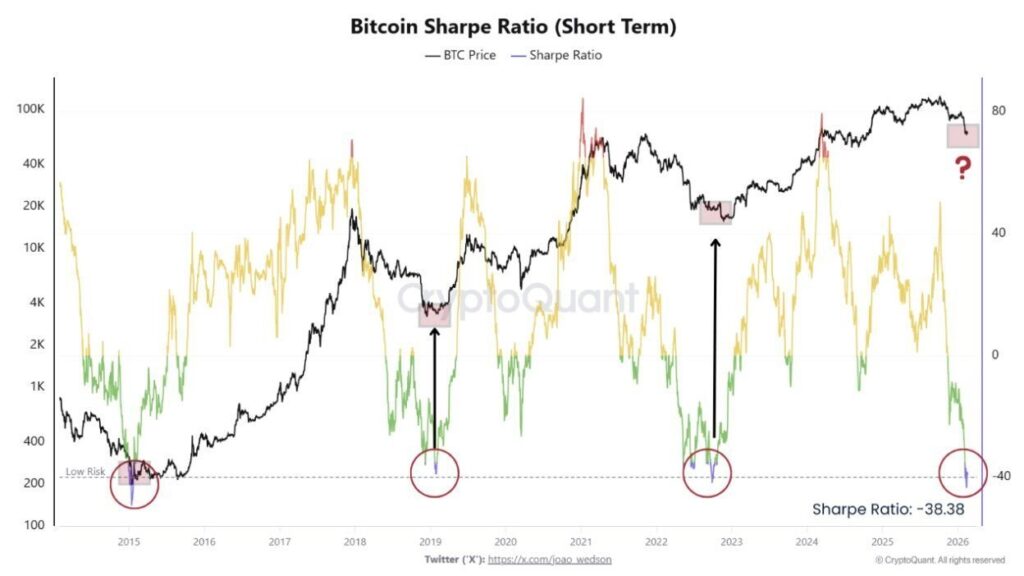
Sharpe Ratio and Risk Analysis
Notably, Bitcoin’s Sharpe Ratio fell to -38.4, indicating how severely its risk-adjusted performance underperformed. Historically, such deep negative levels in early 2015, early 2019, and late 2022 marked “Low Risk” accumulation zones. Interestingly, each occurrence preceded major bull runs, suggesting potential long-term opportunities.
Macro and Market Waves
US stock index futures are down; Nasdaq 100 fell 0.9%. Precious metals surged sharply: gold +2%, silver +5.6%.
Bitcoin’s 12-hour price swings, Polymarket forecasts, whale movements, and on-chain data collectively show the market remains under pressure. Short-term traders continue to sell at a loss, while large investors maintain cautious accumulation. Recent data reflects the immediate state of the market; short-term flows and whale activity confirm the trend remains cautious.
Note: This content does not constitute investment advice and is based on recent on-chain data, market trends, and analysis.
Also, you can freely share your thoughts and comments about the topic in the comment section. Additionally, don’t forget to follow us on our Telegram, YouTube, and Twitter channels for the latest news and updates.