


Bitcoin staged a sharp rebound on February 25 after experiencing a steep intraday sell-off that briefly pushed prices into the low-$60,000 range across major exchanges. The sudden drop triggered approximately $500 million in short liquidations, clearing excessive leverage from the market. Prices quickly recovered, climbing back toward the $69,000 level.
Despite the strength of the bounce, on-chain metrics suggest this move may reflect stabilization rather than a confirmed structural recovery.
What Fueled the Rebound?
Three primary forces appear to have driven the recent rally.
First, broader risk appetite improved across global markets. Equity indices, led by technology stocks, advanced strongly, and Bitcoin traded in correlation with other high-beta assets as investor sentiment shifted toward risk-on positioning.
Second, U.S. spot Bitcoin ETFs recorded $257.7 million in net inflows on February 24. This marked a notable reversal from the previous day’s $203.8 million in outflows. While this single-day inflow provided marginal buying support, year-to-date ETF flows remain negative, indicating that sustained institutional demand has yet to fully return.
Third, derivatives markets underwent a leverage reset. Funding rates in perpetual futures normalized toward neutral levels, signaling that speculative excess had been flushed out. At the same time, short-dated options volatility spiked as Bitcoin approached $62,000, then compressed as price reclaimed the mid-$60,000 range. This pattern suggests panic hedging unwound, contributing to a mechanically driven relief rally rather than fresh long-term accumulation.
Structural Weakness Remains
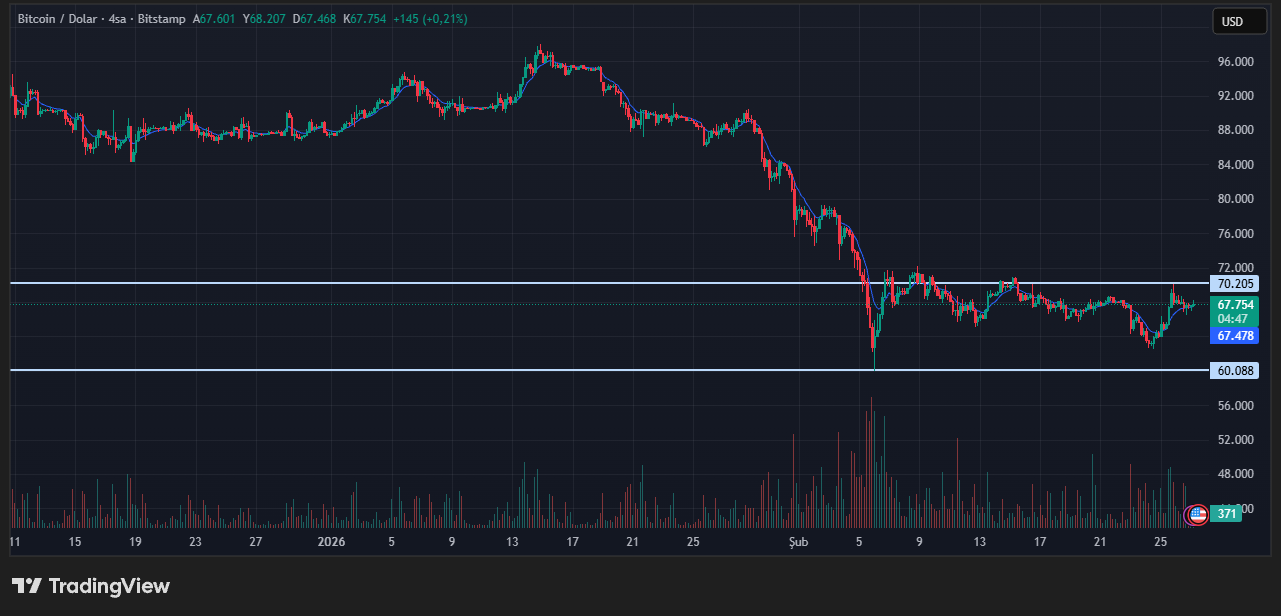
Market data indicates Bitcoin is currently stabilizing within a defined range rather than entering a renewed bull phase. Throughout February, price action has been largely contained between $60,000 and $69,000.
The broader context remains cautious: Bitcoin is still down 47% from its all-time high, a drawdown consistent with mid-to-late bear market conditions historically. Approximately 9.2 million BTC are being held at a loss, creating potential overhead supply as holders may look to exit positions during rallies.
Accumulation metrics remain subdued, and spot market flows continue to show a sell-side bias. Additionally, the 90-day realized profit/loss ratio remains below 1.0, reflecting ongoing liquidity fragility.
The Levels That Matter
The $69,000 area represents the upper boundary of the current trading range. Holding this zone on daily and weekly timeframes would strengthen the bullish case. The $65,000 level acts as mid-range support.
More critically, the $62,000–$62,500 region stands as a key defensive threshold. A decisive break below this zone could have opened the door to a move toward the upper-$50,000s. Beneath that, $60,000 marks February’s range floor, while approximately $55,000 corresponds to the realized price — a major structural support level.
On the upside, sustained movement above $70,000 and then $72,000 would represent the first meaningful signals of regime improvement. A recovery toward $79,200 — the true market mean — would indicate a more definitive structural shift.
For now, Bitcoin’s rebound appears to be a technical and positioning-driven recovery rather than confirmation of a renewed bull market.
This content is for informational purposes only and does not constitute investment advice.
You can also freely share your thoughts and comments about the topic in the comment section. Additionally, don’t forget to follow us on our Telegram, YouTube, and Twitter channels for the latest news and updates.