


Despite recent recovery attempts, Bitcoin is struggling to break through critical resistance levels, and upward movements remain limited for now. The leading cryptocurrency continues to trade below $70,000, a level that represents both psychological and technical resistance. Analysts suggest that the ongoing losing streak may not end in March, and the market could remain in a consolidation phase for a while longer. Historical data shows that Bitcoin is experiencing its fifth consecutive red month. Past cycles indicate that prolonged pullbacks have often been followed by strong recoveries. Therefore, while short-term caution is advised, long-term investors may see the current period as a potential accumulation opportunity.
Bitcoin Faces Three Key Resistances
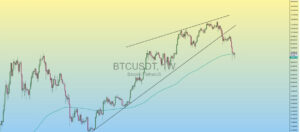
According to TradingView, BTC/USD is trading in the $67,000–$68,000 range after being rejected near the $70,000 psychological level. Bitcoin currently faces three major resistances simultaneously:
- 200-week exponential moving average (EMA): $68,330
- 2021 all-time high: $69,000
- Psychological resistance: $70,000
The convergence of these levels creates a strong technical barrier, limiting upward movement. Analysts note that if Bitcoin can break above this zone, it could signal a significant strengthening of the market.
Crypto analyst Kaptan Faibik stated that Bitcoin needs a weekly close above the 200-week EMA to maintain bullish momentum. If this level is reclaimed, an $80,000 target could come back into focus. Faibik commented:
“If the weekly candle closes above the 200-week EMA, we could see a recovery toward $80,000 in the coming weeks. March could be a good month.”
Bitcoin Hits Fifth Consecutive Red Month
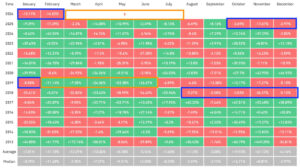
CoinGlass data shows that Bitcoin lost approximately 14% in February, marking its fifth straight red month—the last time this happened was during the most severe periods of the 2018 bear market. Analyst Alex notes that Bitcoin is approaching a rare losing streak, and historical patterns suggest strong rallies often follow such periods. For instance, in 2018–2019, after five consecutive down months and a roughly 57% decline, Bitcoin experienced five consecutive green months, climbing 317%. If this historical pattern repeats, selling pressure may ease, and the market could reverse starting in April. Analysts suggest that overcoming the $68,000–$70,000 resistance band could allow Bitcoin to retest levels above $74,500. Failure to break these levels may result in continued sideways movement and pressure.
Critical Weeks Ahead for Bitcoin
Bitcoin is currently trading in a technically and psychologically critical zone. Consecutive red months have made investors cautious, but history also indicates the possibility of a strong recovery. Whether Bitcoin can break the $70,000 resistance during March will be a key factor in determining its short- and medium-term direction.
In the comment section, you can freely share your thoughts and comments about the topic. Additionally, please follow us on our Telegram, YouTube, and Twitter channels for the latest news.