


Bitcoin briefly climbed above $68,000, signaling a short-term recovery, but met strong selling pressure around the $70,000 level. BTC reached as high as $70,100 but could not hold, retracing some of its gains. This highlights that the $70,000 area remains a key psychological and technical resistance. Currently, Bitcoin is consolidating above $68,000, with the market showing indecision. The $69,200 level stands out as a short-term critical threshold—breaking it could trigger another test of $70,000. However, attempts to push higher without solid volume support may face renewed selling pressure, so traders are closely monitoring both resistance and support levels.
Why $70,000 Is Important
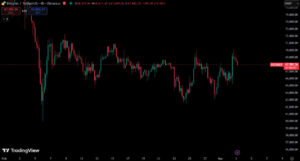
After establishing a strong base around $65,500, Bitcoin started a new uptrend, surpassing resistance levels at $66,500 and $68,000. The hourly chart shows a bullish break above the $66,800 downtrend line, signaling short-term momentum. Yet, momentum weakened approaching $70,000 as selling pressure increased. The $70,100 peak led to a minor retracement, dipping below the 23.6% Fibonacci retracement of the move from $63,030, suggesting short-term profit-taking and a cautious market sentiment. For the uptrend to continue, sustained volume and a clear break above key resistance levels are needed.
Technical Levels for the Upside
- Initial resistance: $69,200
- Main resistance: $69,500
- Psychological barrier: $70,000
- Next targets: $70,500 – $70,850 – $71,200
Hourly closes above $69,500 could set the stage for a retest and potential breakout of $70,000.
Downside Risks
If Bitcoin fails to break $70,000, selling pressure may return:
- Immediate support: $68,000
- Stronger support: $67,500
- Further downside: $65,650 (intermediate), $65,000 (critical), $64,200 (major support)
A drop below $67,000 could weaken the short-term outlook and lead to a deeper correction. Hourly MACD remains in the bullish zone but shows weakening momentum, while the hourly RSI stays above 50, indicating no decisive selling pressure yet. For stronger upward momentum, RSI would need to rise above 60.
Summary
Bitcoin faces a strong, multi-layered resistance at $70,000, both psychological and technical. Short-term movements above $69,200 could indicate renewed buyer strength and the start of a new rally. A breakout with volume support would increase the likelihood of retesting $70,000. Conversely, a drop below $67,500 could deepen the correction toward lower support zones. The $67,500–$69,200 range is a critical consolidation zone in the near term. Transaction volume and closing levels in the coming hours will be key in determining whether Bitcoin can initiate another upward move.
You can also freely share your thoughts and comments about the topic in the comment section. Additionally, don’t forget to follow us on our Telegram, YouTube, and Twitter channels for the latest news and updates.