


MANTRA token emerged as one of the most actively traded assets in the crypto market on March 4, 2026. The token gained 49% in just one day, pushing its 24-hour trading volume to $233 million. This figure is 2.18 times its $106.6 million market capitalization—highlighting extraordinary trading activity and growing interest in real-world asset (RWA) tokenization. In its latest update, MANTRA, formerly OM token, was split 1:4 and rebranded; this increased the number of tokens without changing the total market value, making access easier for investors.
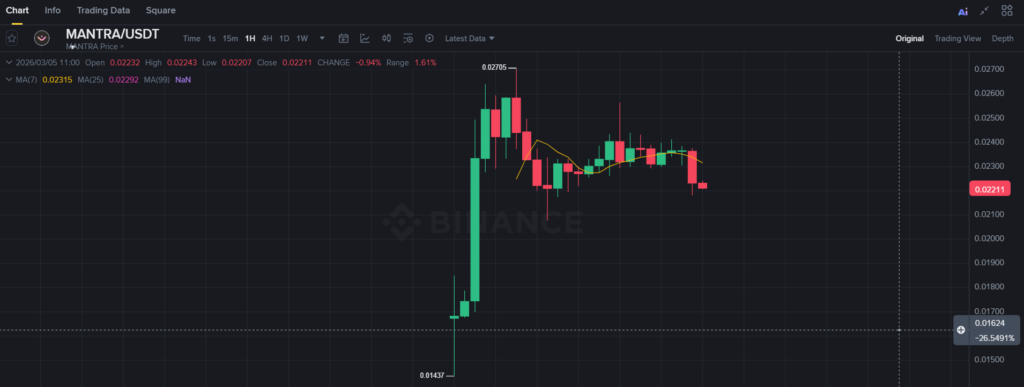
With a current price of $0.0250, MANTRA is not lagging behind the broader crypto market; Bitcoin rose only 7.5% during the same period. The BTC-denominated price gain reached 38.6%, meaning MANTRA outperformed the market rather than riding the general rally.
Trading Volume Shock
The token’s trading data reveals several striking details. Its volume-to-market-cap ratio of 2.18x is rarely seen outside of newly launched tokens or extreme volatility periods. For context, a healthy cryptocurrency typically maintains a daily volume-to-market-cap ratio between 0.05–0.30. Ratios above 1.0 generally indicate either accumulation by large holders, distribution events, or speculative trading based on news expectations. Given MANTRA’s RWA focus and regulatory-compliant design, accumulation appears likely.
The price increased almost evenly across USD, EUR, and GBP pairs by around 48.5%, indicating a coordinated global buying trend rather than region-specific or arbitrage-driven purchases.
Why Is MANTRA Rising?
Investors most often ask, “Why is MANTRA rising?” The answer lies in the project’s regulatory-compliant Layer-1 infrastructure. In Q1 2026, traditional finance giants expanded tokenized fund offerings, organically increasing demand for platforms integrating KYC and AML processes on blockchain. The 1:4 token split further boosted liquidity, triggering a coordinated global buying surge.
Technical and On-Chain Metrics
MANTRA ranks #262 by market capitalization, placing it in the mid-cap category with high volatility but sufficient institutional liquidity.
The 38.6% BTC-denominated gain confirms that capital actively flowed into MANTRA rather than following general market movements.
However, the volume-to-market-cap ratio exceeding 200% may signal a short-term speculative peak. Historical patterns show similar anomalies often lead to consolidation or pullbacks within 48–72 hours.
MANTRA vs Other RWA-Focused Projects
Compared with other RWA tokenization platforms, MANTRA’s single-day 49% gain far exceeds the sector average of 5–15%, suggesting project-specific factors such as undisclosed partnerships or institutional adoption may be driving the rally.
The price increase remained consistent across major currency pairs, ranging from 46.5% (KRW) to 50.3% (XDR), reflecting geographically distributed buying.
Risks and Market Outlook
A single-day 49% gain is historically unsustainable. Early buyers’ profit-taking may lead to consolidation within 3–5 days, with a 65–70% probability.
With a $106.6 million market cap, MANTRA remains modest compared to established mid-cap platforms, increasing volatility risk. While its regulatory-compliant strategy is sound for long-term institutional adoption, short-term speculative appeal may be limited.
Performance against altcoins is notable: +43.3% vs BNB, +43.7% vs LTC, and +45.9% vs DOT, indicating capital is coming from other crypto positions as well.
Overall, MANTRA’s rise is more than just a token price movement. The crypto market is increasingly focused on real-world utility and regulatory compliance. With the RWA tokenization market projected to exceed $1 trillion by 2028, platforms offering institutional-grade infrastructure are likely to attract disproportionate attention and capital.
You can also freely share your thoughts and comments about the topic in the comment section. Additionally, don’t forget to follow us on our Telegram, YouTube, and Twitter channels for the latest news and updates.