


Recent long-term market analysis suggests that Bitcoin may be approaching a decisive phase as 2026 draws closer. While the asset has matured significantly over the years, structural indicators imply that price stability could be tested if the market enters an extended consolidation period. One model in particular — the power law framework — highlights the $65,000 level as a potential turning point for Bitcoin’s next major trend.
What the Bitcoin Power Law Model Indicates
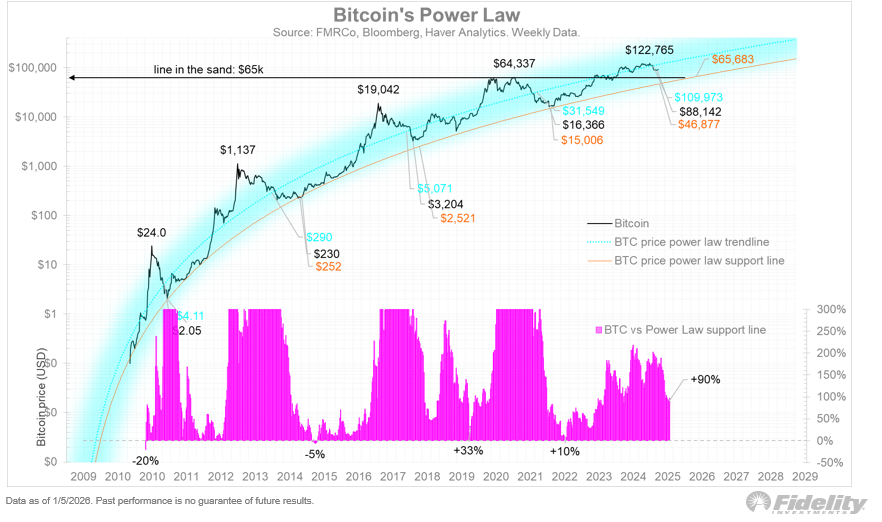
The power law model is designed to assess Bitcoin’s long-term “fair value” by mapping price behavior against a persistent growth curve. Historically, periods when BTC drifted toward the lower boundary of this curve have often coincided with major long-term bottoms.
Throughout much of the previous bull cycle, Bitcoin traded close to its power law trend. However, recent price action suggests that a retest of deeper support zones cannot be ruled out. At present, the lower power law support sits near the $45,000 region. If Bitcoin spends most of 2026 moving sideways, this lower trendline could gradually rise toward $65,000, effectively turning that level into a decisive battlefield for the market.
Are Four-Year Cycles Still Relevant?
Another key debate resurfacing among analysts is whether Bitcoin’s traditional four-year cycle structure remains intact. While halving events continue to influence supply dynamics, their impact appears to be diminishing as the market grows larger and more institutionally integrated.
Despite this evolution, the idea that Bitcoin has completely outgrown bear markets is widely questioned. Market observers argue that corrections and downcycles are still a natural part of price discovery, even if volatility is lower and cycles are longer than in earlier years.
What a “Compressed” Price Structure Means
Bitcoin’s current positioning below its long-term growth trajectory suggests a compressed price structure. Historically, such conditions have not persisted indefinitely. Instead, they have typically resolved through a directional move that allows price to realign with long-term growth expectations.
Importantly, past examples show that this realignment usually occurs through price movement rather than a breakdown of the underlying growth model itself. This keeps the possibility of a recovery-driven breakout firmly on the table.
You can also freely share your thoughts and comments about the topic in the comment section. Additionally, don’t forget to follow us on our Telegram, YouTube, and Twitter channels for the latest news and updates.