


Bitcoin started the year trading around $87,700. Within just a few weeks, it shed roughly $20,000, sliding toward the $68,000 range. On the surface, it looks like a standard correction. But once you dig into the numbers, a different story begins to emerge.
The first two months of 2026 alone already represent a 22.3% drawdown for BTC. If this pace holds, the market could be heading toward its weakest first quarter since 2018. That period is still fresh in memory: nearly a 50% collapse in just three months.
Short answer? Yes — it’s on the table.
The longer answer is more layered.
Q1 statistics are flashing warning signs
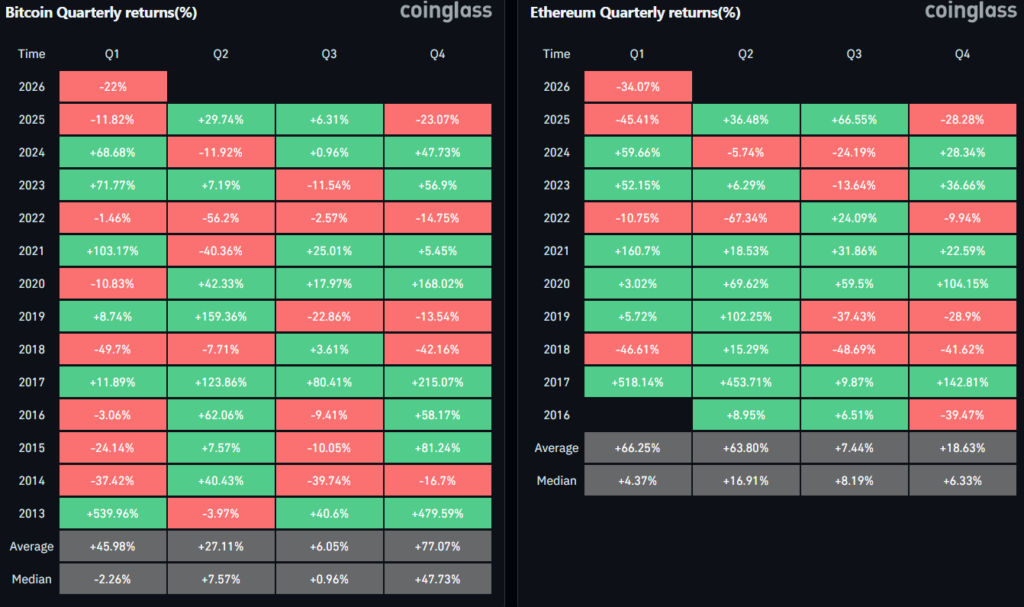
Historically, Bitcoin has closed seven of its thirteen first quarters in the red. The hardest hit came in 2018, with a brutal 49.7% drop. More recent examples include losses of 10.8% in 2020 and 11.8% in 2025 — figures clearly reflected in CoinGlass records.
Crypto analyst Daan Trades Crypto noted over the weekend that first quarters are historically volatile by nature. In other words, what unfolds during Q1 often doesn’t translate directly into the rest of the year.
There’s another notable detail: Bitcoin has only recorded back-to-back losing first quarters twice — in 2018 and 2022. Both were bear-market years.
January and February could both close red for the first time
This may be the most striking signal.
Bitcoin fell 10.2% in January. February is already down 13.4%. If price fails to reclaim $80,000 before month-end, Bitcoin will, for the first time ever, close both January and February in negative territory.
That seemingly small statistic is now firmly on the radar of everyone from algorithmic traders to long-term funds.
Ethereum isn’t faring much better either. While ETH has only posted red first quarters three times historically, the current period is shaping up as its third-worst Q1 on record, with losses already reaching 34.3%.
“This isn’t a collapse — it’s a classic correction”
Speaking on behalf of LVRG Research, Nick Ruck described the pullback as a “classic correction phase” rather than a structural breakdown.
He acknowledged that global uncertainty could intensify short-term pressure, but emphasized that Bitcoin has historically shown resilience after similar periods. Continued institutional interest and the underlying halving cycle narrative still support the medium-term outlook.
Over the past 24 hours, BTC slipped another 2.3%, trading near $68,600 at the time of writing. Current pricing aligns with data from CoinGecko. The story was originally reported by Cointelegraph.
The market has paused — but data flow is accelerating
On-chain metrics show declining spot volume, while derivatives markets are seeing open interest rise again. That combination typically points to a “hesitant bottom” phase. Panic selling may be fading, but direction remains unresolved. The next few days — especially alongside U.S. macro releases — could shape Bitcoin’s short-term trajectory.
Bitcoin is now down more than 22% year-to-date, has logged five consecutive losing weeks, and is edging toward its first ever dual red January–February close. On the surface, the picture looks unsettling. Yet past cycles suggest Q1 turbulence doesn’t always define the year.
For now, the market sits in a kind of waiting room — quiet, tense, and highly sensitive.
You can also freely share your thoughts and comments about the topic in the comment section. Additionally, don’t forget to follow us on our Telegram, YouTube, and Twitter channels for the latest news and updates.