


Cryptocurrency exchange Coinbase, in its latest market report, provided a detailed technical outlook and potential scenarios for Bitcoin’s price. The report went beyond classic support and resistance levels, analyzing option market positioning and “gamma exposure” data as well. According to Coinbase analysts, the current market structure is too complex to be understood by looking at spot charts alone. Hedge flows in the options market can either stabilize or accelerate price movements. Coinbase highlights two main scenarios for Bitcoin, with the ability of critical levels to hold or break being decisive for the market’s direction.
Key Support and Resistance Levels for Bitcoin
Coinbase analysts identify $60,000 as the strongest support cluster for Bitcoin. This level is seen as a critical threshold for the market to hold in case of pullbacks. On the upside, the first significant resistance band is at $82,000. Price behavior between these two levels will be key for determining the medium-term trend. The report emphasizes that investors should not focus solely on technical chart levels. Hidden liquidity dynamics created by option market positioning can have a direct and strong impact on price movements. Gamma exposure data provides critical signals for understanding mechanisms that either dampen or accelerate volatility, making it important for investors to consider these derivative market metrics in risk management.
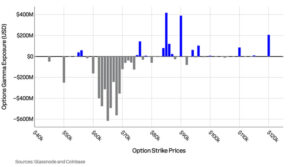
Gamma exposure reflects how option market makers hedge against price movements. In positive gamma regions, market makers sell when prices rise and buy when prices fall, generally stabilizing the market and reducing volatility. In negative gamma regions, the opposite occurs: rising prices trigger buying and falling prices trigger selling, which can strengthen trends, cause sharper breakouts, and accelerate liquidations.
According to the report:
- A negative gamma band exists between $60,000–$70,000, suggesting downward moves could be fast and volatile.
- Positive gamma clusters appear between $85,000–$90,000, indicating upward moves may be more limited, choppy, and range-bound.
Upside Scenario: $82,000 as First Major Test
Coinbase analysts note that $82,000 will be the first significant test for Bitcoin. If the price struggles to surpass this level, strong resistance could lead to failed breakout attempts and a short-term pullback. Profit-taking and increased selling pressure would likely follow. If Bitcoin surpasses $82,000 with volume and the level holds as support, it could move toward higher liquidity bands. However, the concentrated positive gamma positions between $85,000–$90,000 suggest that even if the rally continues, the move may be controlled, gradual, and range-bound rather than sharp.
On the downside, $60,000 is the critical support level. A test of this area followed by a quick recovery could trigger short-term buying opportunities. However, negative gamma effects may make drops toward this level sharp, rapid, and highly volatile. If $60,000 fails to hold, selling pressure could increase and declines could extend further, potentially accelerating liquidations and weakening investor sentiment. Coinbase analysts stress that investors should prioritize risk management and exercise caution around these key levels.
Assessment
Coinbase’s report shows that Bitcoin’s price could unfold around two critical scenarios:
- Upside: $82,000 as key resistance for breakout potential
- Downside: $60,000 as main support preventing accelerated declines
Evaluating gamma exposure in conjunction with technical levels provides a more comprehensive market view. Reactions between these two critical levels in the coming period could determine Bitcoin’s medium-term trend.
You can freely share your thoughts and comments about the topic in the comment section. Additionally, please don’t forget to follow us on our Telegram, YouTube and Twitter channels for the latest news and updates instantly.