


Bitcoin has regained attention in the markets after breaking through an important technical level. The leading cryptocurrency has climbed above its 50-day moving average for the first time in roughly two months, a development that many market participants view as a sign of strengthening bullish momentum.
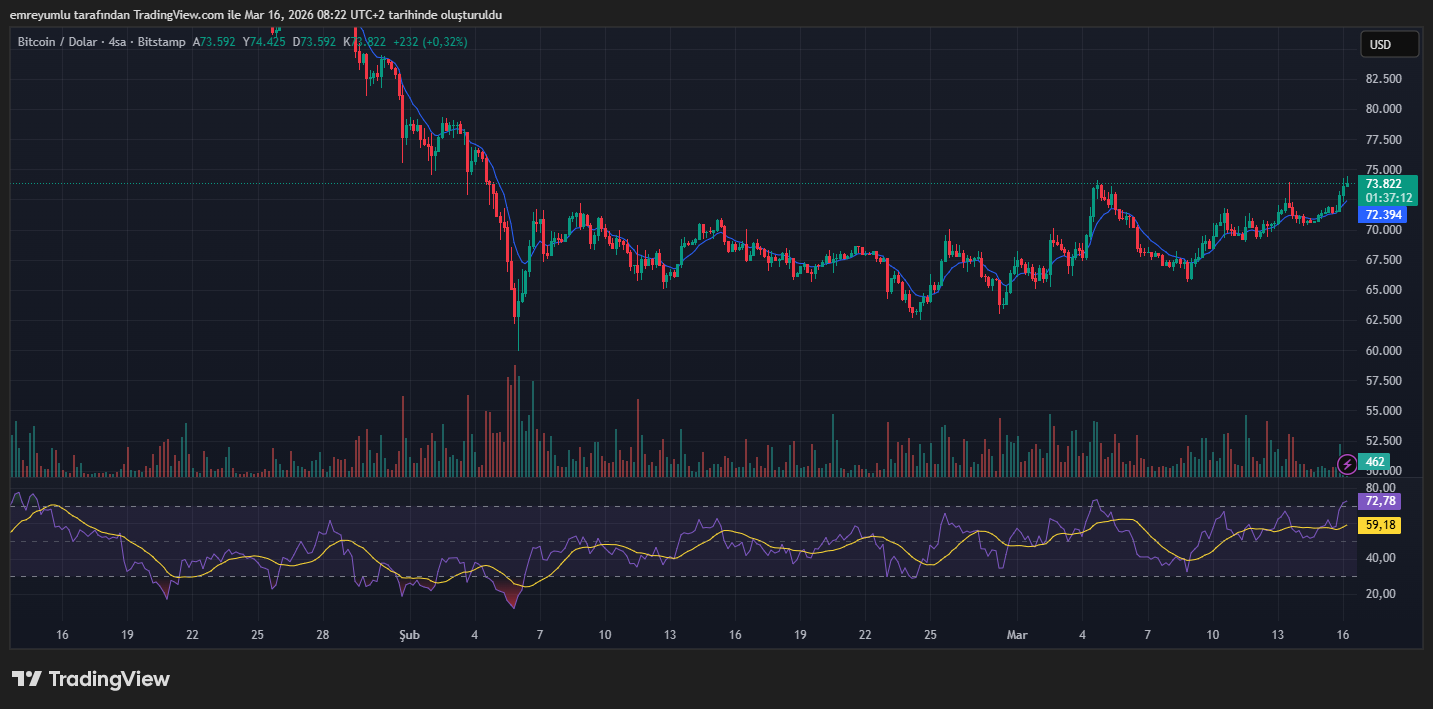
Over the past 24 hours, Bitcoin has gained more than 3%, pushing its price to around $73,700. With this move, the asset has managed to rise above the 50-day moving average, which was hovering near $71,125 at the time of the move.
Why the 50-Day Moving Average Matters
The 50-day moving average is one of the most widely used indicators in financial markets when assessing medium-term trends. Traders and analysts frequently rely on this metric to determine whether market sentiment is leaning bullish or bearish.
When an asset trades below this level for an extended period and then successfully breaks above it, the move is often interpreted as a potential signal of improving market conditions. Such breakouts can suggest that buying pressure is returning and that the market may be entering a new phase of upward momentum.
Market observers note that maintaining price action above this level in the coming days could be an important factor in confirming the strength of the current trend.
Resilience Despite Global Uncertainty
Bitcoin’s recent upward movement has taken place against a backdrop of global market volatility. Geopolitical tensions in the Middle East and developments related to Iran have contributed to fluctuations across financial markets, while several Asian equity markets have also experienced notable instability.
Despite these pressures, Bitcoin has shown relative resilience. The ability of the cryptocurrency to advance during a period of global uncertainty has drawn attention from investors who are increasingly evaluating digital assets within the broader macroeconomic landscape.
Can the Rally Continue?
Although breaking above the 50-day moving average is generally seen as a positive technical signal, it does not guarantee the continuation of a sustained uptrend.
Historical examples illustrate that similar breakouts have produced mixed outcomes. Earlier in the year, Bitcoin experienced a comparable move that led to an approximately 8% price increase. However, that rally lasted only about two weeks before selling pressure returned to the market.
For this reason, analysts caution that while the recent breakout is encouraging, it should not be viewed as definitive proof of a long-term bullish trend.
Focus Shifts to the $75,000 Level
If Bitcoin’s upward momentum continues, the next key level attracting market attention is $75,000. This area is particularly significant in derivatives markets, where a large concentration of positions is believed to exist.
Market makers are reportedly holding substantial short gamma exposure around this level. As prices move closer to $75,000, these participants may need to buy Bitcoin to rebalance their positions, a dynamic that could increase price volatility.
As a result, any approach toward the $75,000 mark may lead to heightened market activity and sharper price movements in the near term.
This content is for informational purposes only and does not constitute investment advice.
Also, in the comment section, you can freely share your comments and opinions about the topic. Additionally, don’t forget to follow us on Telegram, YouTube and Twitter for the latest news and updates.