


Bitcoin (BTC) returned to the historical pivot zone around $109,000 on the final trading day of the week. This area is seen as a highly critical threshold — not only from a technical analysis perspective but also in terms of market psychology.
When examining previous market cycles, the $109,000 range has often marked the point where bull markets regained momentum or bear trends deepened. For this reason, investors commonly refer to this level as the “turning point zone.” According to experts, Bitcoin’s reaction at this level will be one of the key factors determining the market’s direction in the coming weeks.
Medium-Term Outlook: Uncertainty Within a Sideways Channel
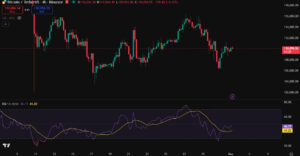
On Friday, Bitcoin’s price rose approximately 1.5%, reaching $109,870. This increase is viewed as a short-term relief rally following the sharp sell-offs earlier in the week. However, the long-wicked candlestick formations on the daily charts indicate that the market is still facing strong selling pressure. While this causes retail investors to act cautiously, the continued accumulation by whale addresses in recent days suggests that major players are maintaining their long-term bullish outlook.
$109,000 Level: The Historical Pivot Point
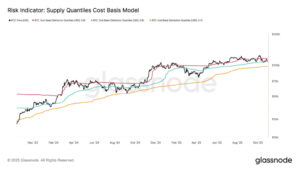
According to on-chain data from Glassnode, Bitcoin is currently trading within the 0.85 cost-based band. Historically, this band has coincided with points where market cycles have shifted direction. Experts note that daily closes above $109,000 are critical for sustaining bullish momentum, but if this support is lost, the price could decline toward the 0.75 band around $98,000. In past cycles, breakdowns below this level have typically led to prolonged corrections, while holding above it has often triggered strong upward trends.
Rising Institutional Volume and Whale Activity
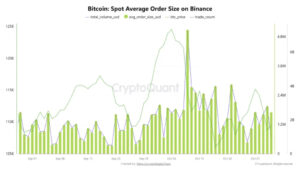
According to data from CryptoQuant, Bitcoin’s average spot trade size rose to $1.96 million in October one of the highest monthly averages of the year. This figure indicates that institutional traders are becoming active again in the spot market. Additionally, daily Bitcoin spot trading volume on Binance reached $2.82 billion, highlighting renewed engagement from large capital players. This increase suggests that, despite short-term volatility, big money continues to take positions in the market, reflecting sustained long-term confidence in Bitcoin’s outlook.
Bitcoin fell by 5.9% on a weekly basis, dropping from $116,381 to $109,502. This movement, accompanied by rising trading volume, indicates that sellers remain active in the market. The price is currently testing the 200-day Exponential Moving Average (EMA) level. A breakdown below this support could intensify selling pressure and push the price down toward the lower boundary of the expanding channel near $102,560.
Overall Assessment: Bitcoin in Search of Balance
Despite October’s decline, Bitcoin’s long-term on-chain metrics remain positive. The continued whale accumulation and increase in institutional volume suggest that panic selling has not yet begun. In the short term, a consolidation between $109,000 and $112,000 could help stabilize the market. However, daily closes below $109,000 could technically bring the $98,000–$100,000 zones back into focus.
You can also freely share your thoughts and comments about the topic in the comment section. Additionally, don’t forget to follow us on our Telegram, YouTube, and Twitter channels for the latest news and updates.