


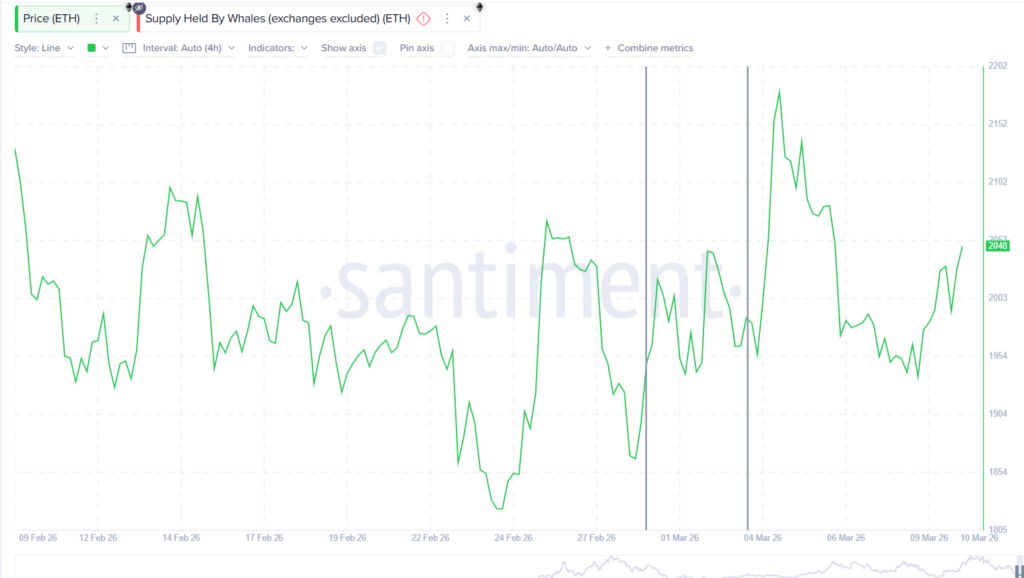
Ethereum has risen approximately 7% since March 8. The 8-hour chart shows an RSI divergence, with prices forming lower lows while the RSI forms higher lows. A similar divergence between February 15 and March 1 triggered a 15% rise. Now, as the recovery approaches $2,200, on-chain data is warning investors.
RSI Divergence and Historical Examples
The classic RSI divergence between February 15 and March 1 allowed Ethereum to rise 15% and reach a peak near $2,200. The current movement follows a similar technical pattern. However, on-chain accumulation and exchange outflows that supported the previous rise are not as strong this time.
Exchange Flows: Rising Inflows and Selling Pressure
On March 9, the exchange net position change turned positive, with inflows reaching 146,709 ETH. Rising inflows typically indicate that investors are moving coins onto exchanges, increasing the likelihood of selling pressure. Facing selling pressure immediately after this divergence is not a positive sign for bullish hopes.
Whale behavior has also shifted. Large investors reduced their holdings from 113.70M ETH on March 7 to approximately 113.61M ETH on March 10, a decrease of around 90,000 ETH. This combination shows that the current recovery lacks the accumulation support that fueled the previous 15% ETH price rise.
On-Chain Cost Data and Resistance Levels
URPD data shows that over 4% of Ethereum’s supply is concentrated between $2,030 and $2,180. These areas act as resistance where investors may sell near their cost basis.
-
$2,130: The first critical level that must be breached for a strong move.
-
$2,200: Psychological resistance that capped the March rise; 8-hour close here is important.
-
$2,270: Next major supply cluster; must be overcome for sustained bullish momentum.
A drop below $2,000 could weaken the recovery thesis, and a further decline toward $1,910 would reinforce the overall downtrend. Ethereum must first surpass $2,130 to maintain bullish hopes. The next key hurdle is the psychological $2,200 level, which limited the previous March rise. A confirmed 8-hour close above $2,200 would indicate absorption of nearby supply clusters and open the path toward $2,270.
Short-Term Perspective
The current recovery appears technically valid. However, on-chain data, whale activity, and dense supply clusters suggest that the rally may face stronger resistance than the previous attempt. Can Ethereum overcome these barriers, or will selling pressure return?
Also, you can freely share your thoughts and comments about the topic in the comment section. Additionally, please follow us on our Telegram, YouTube and Twitter channels for the latest news and updates.