

The Golden Ratio Multiplier is a technical analysis tool used to analyze Bitcoin’s price movements. Based on the Fibonacci sequence and the golden ratio (1.618), this indicator visualizes Bitcoin’s long-term price cycles and helps investors identify potential buying and selling opportunities. It is particularly designed for long-term investors who aim to understand Bitcoin’s market cycles and evaluate its price within a historical context. So, what exactly is the Golden Ratio Multiplier, what does it do, and how is it used?
What is the Golden Ratio Multiplier?
The Golden Ratio Multiplier is an indicator that analyzes Bitcoin’s price by multiplying its 200-week moving average (200 WMA) with a series of coefficients derived from the golden ratio (1.618) and the Fibonacci sequence. The indicator shows how Bitcoin’s price behaves at these coefficient levels, identifying zones where the market is overvalued or undervalued.
The Golden Ratio Multiplier is commonly used to understand Bitcoin’s long-term bull and bear markets. Each coefficient level indicates where Bitcoin’s price has historically encountered support or resistance. For instance, lower coefficient levels (0.5x, 1x) typically signal buying opportunities, while higher levels (3.6x, 5.8x) suggest potential selling or correction risks.
This tool, popularized by Philip Swift, has gained traction among investors, particularly through Swift’s LookIntoBitcoin platform. The Golden Ratio Multiplier provides a robust guide for analyzing long-term trends by considering Bitcoin’s logarithmic growth curve.
Golden Ratio Multiplier Levels and Their Meanings
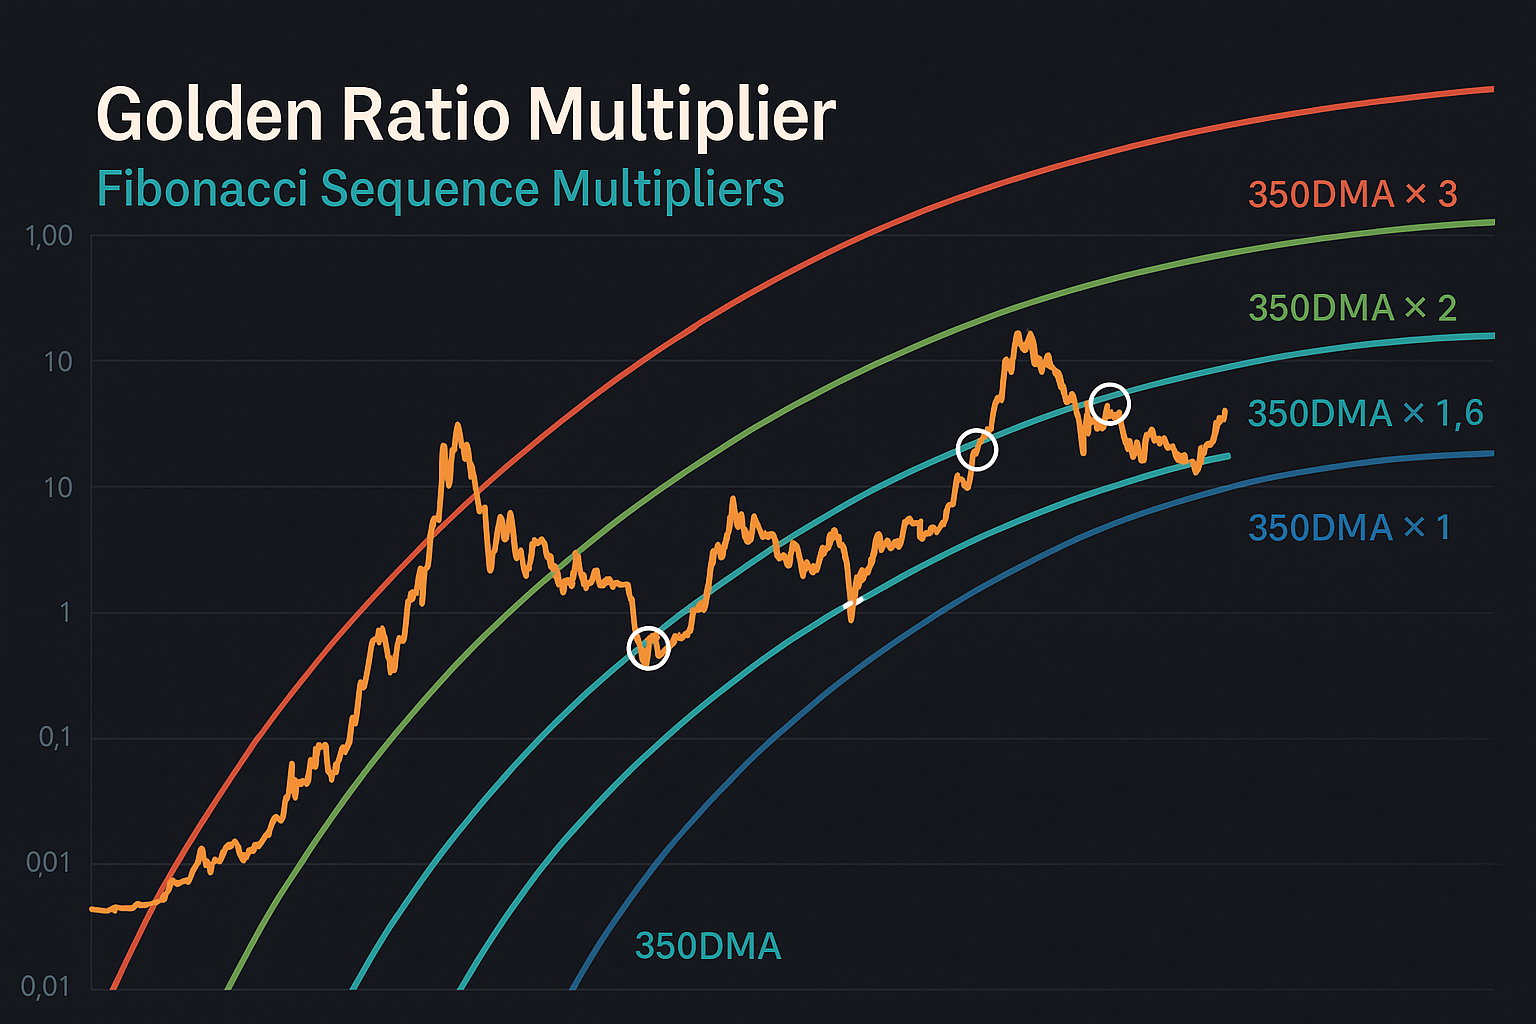
The indicator classifies Bitcoin’s price based on the 200-week moving average multiplied by different coefficients. Each level represents a distinct market phase. Here are the key levels and their meanings:
- 350 DMA (Yellow Line): Bitcoin’s 350-day simple moving average, serving as the baseline reference.
- x1.6 (Light Blue Line): When Bitcoin’s price reaches 1.6 times the 350 DMA, it is typically in the middle of a bullish phase, approaching overbought territory.
- x2 (Red Line): At 2 times the 350 DMA, the market often enters the upper regions of a cycle, signaling a potential profit-taking zone.
- x3 (Blue Line): Frequently tested during high-momentum bull markets, this level represents strong bullish periods.
- x5 (Green Line): Historically associated with Bitcoin’s major rallies, this level is very close to cycle peaks.
- x8 (Orange Line): Seen during highly speculative periods, this level is rarely reached and often signals cycle tops.
- x13 (Purple Line): Represents extreme bubble territory, a level rarely achieved.
- x21 (Pink Line): The most extreme peak levels Bitcoin has historically reached, typically before a bubble bursts.
These levels allow investors to quickly assess where Bitcoin’s current price stands within historical cycles. When used on a logarithmic scale, the indicator clearly highlights Bitcoin’s long-term growth trend.
What Does the Golden Ratio Multiplier Do?
The Golden Ratio Multiplier is used to understand Bitcoin’s price cycles and make strategic investment decisions. Its main functions include:
- Analyzing Market Cycles
The Golden Ratio Multiplier visualizes Bitcoin’s bull and bear markets in a historical context. For example, if the price is at the 0.5x level, historical data suggests it may be a strong buying opportunity, helping investors gauge the market’s current state. - Identifying Buying and Selling Opportunities
Low coefficient levels (0.5x, 1x) indicate undervalued periods, potentially suitable for buying. High coefficient levels (3.6x and above) may signal selling or position-reduction opportunities, helping investors avoid emotional decisions. - Understanding Long-Term Trends
Despite Bitcoin’s short-term volatility, the Golden Ratio Multiplier provides a logarithmic perspective, highlighting long-term trends. This is particularly valuable for investors adopting a “HODL” strategy. - Connection with Bitcoin Halving
Bitcoin’s halving events, which occur every four years and reduce the supply, have a long-term impact on price. The Golden Ratio Multiplier shows how price movements post-halving typically concentrate around certain coefficient levels, such as starting at 0.5x or 1x and climbing to higher levels over time. - Risk Management
High coefficient levels indicate an overheated market with increased correction risks, enabling investors to reassess their portfolios and manage risk.
How to Use the Golden Ratio Multiplier?
- Determine the Current Price Level
Check the chart to see which coefficient level Bitcoin’s current price corresponds to. For example, a price at the 0.5x level may indicate a buying opportunity. - Interpret the Levels
Learn the significance of each coefficient level. Lower levels (green tones) suggest buying opportunities, while higher levels (orange and red) signal caution or selling. - Analyze Historical Trends
Examine how the market reacted when the price was at the same coefficient level in the past. This provides clues about potential future movements. - Combine with Other Indicators
Use the Golden Ratio Multiplier alongside other technical indicators like RSI, MACD, Bitcoin Stock-to-Flow (S2F) model, or the Rainbow Indicator for more robust investment decisions. - Consider Market Context
Macroeconomic events, regulations, or technological developments in the Bitcoin network can impact prices. Evaluate the indicator in light of these factors.
Advantages and Limitations of the Golden Ratio Multiplier
Advantages:
- Clearly visualizes long-term trends.
- Offers a mathematical foundation based on the golden ratio and Fibonacci principles.
- Intuitively highlights buying and selling opportunities.
- Aligns with Bitcoin’s halving cycles.
Limitations:
- Limited effectiveness for short-term price predictions.
- Relies on historical data, which may not fully reflect future market conditions.
- External factors (e.g., regulations or macroeconomic events) can affect the indicator’s accuracy.
Disclaimer: This content is for informational purposes only and does not constitute investment advice. Cryptocurrency investments carry high risks. Always conduct your own research and consider your risk tolerance before making investment decisions.
You can also freely share your thoughts and comments about the topic in the comment section. Additionally, don’t forget to follow us on our Telegram, YouTube, and Twitter channels for the latest news and updates.