

The Rainbow Indicator is a technical analysis tool that visualizes Bitcoin’s long-term price trends and highlights potential buying and selling opportunities through colorful bands. Created on a logarithmic scale, this chart analyzes Bitcoin’s historical price movements to make it easier to understand market cycles and the current price’s place within a historical context. So, what exactly is the Rainbow Indicator, and what is it used for? In this article, we will explore this popular tool in detail.
What is the Rainbow Indicator?
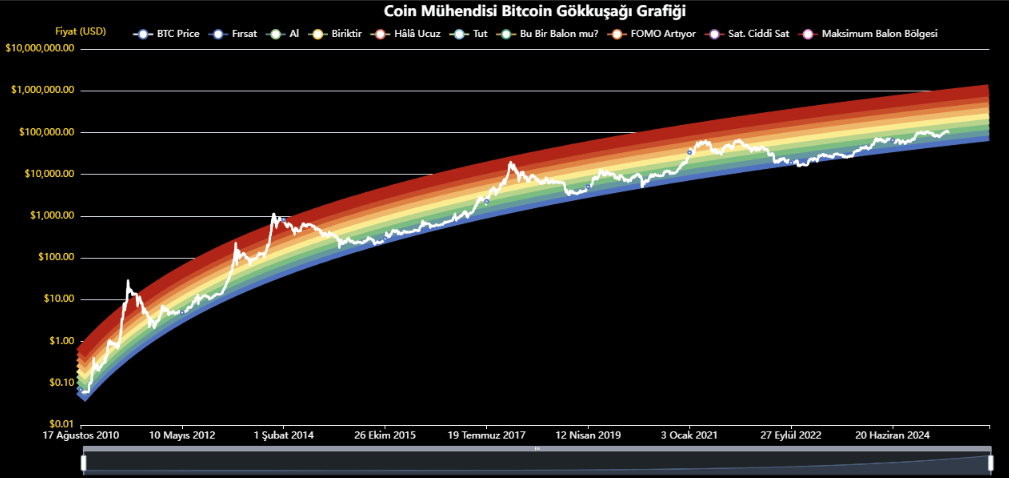
The Rainbow Indicator is a visual analysis tool that analyzes Bitcoin’s price on a logarithmic scale and represents different price ranges with colored bands. Each color band reflects Bitcoin’s position within a specific market cycle and investor psychology. For instance, blue and green tones typically represent “buying opportunities” or “undervalued” zones, while orange and red tones signal “selling” or “overvalued” zones.
This indicator was first introduced in 2014 by a Reddit user named “azop” and was later refined in 2019 by “Rohmeo,” becoming known as the Rainbow Indicator V2. Today, it is widely used on platforms like BlockchainCenter and TradingView, serving as an effective guide for long-term investors to understand Bitcoin’s historical price cycles.
Color Bands and Their Meanings
The Rainbow Indicator classifies Bitcoin’s price into nine different color bands, each representing a distinct phase of the market cycle:
- Dark Blue (“Basically a Fire Sale!”): A region where Bitcoin is extremely undervalued. This is typically seen as a buying opportunity after a significant market correction.
- Blue (“BUY!”): A region where Bitcoin is highly undervalued. This can be an attractive entry point for investors.
- Green (“Accumulate”): A region where Bitcoin is undervalued. It’s considered a suitable time for long-term investment.
- Light Green (“Still Cheap”): A region where Bitcoin is reasonably valued but still attractive for buying.
- Yellow (“HODL!”): A neutral region where Bitcoin is fairly valued. Investors typically hold their positions.
- Orange (“Is this a bubble?”): A region where Bitcoin’s value starts to exceed its norm. Caution is advised.
- Light Red (“FOMO Intensifies”): A region where Bitcoin is likely overvalued. Investor enthusiasm increases.
- Red (“Sell, Seriously, SELL!”): A region where Bitcoin is highly overvalued. The risk of a correction is significant.
- Dark Red (“Maximum Bubble Territory”): A region where Bitcoin is extremely overvalued. There is a high risk of a major price bubble.
These color bands allow investors to quickly grasp market trends and provide an intuitive guide, especially for those with limited technical analysis knowledge.
What is the Rainbow Indicator Used For?
The Rainbow Indicator is used to make sense of Bitcoin’s volatile nature and support long-term investment decisions. Here are its primary functions:
1. Visualizing Market Cycles
The Rainbow Indicator visualizes Bitcoin’s long-term price movements on a logarithmic scale, highlighting past market cycles. This helps investors understand where the current price stands in a historical context. For example, if the price is in the blue band, investors can examine how the market reacted at similar levels in the past.
2. Identifying Buying and Selling Opportunities
The color bands indicate potential buying and selling zones. Blue and green bands signal periods when Bitcoin is undervalued, while orange and red bands indicate times for selling or exercising caution. This helps investors avoid panic selling or overly enthusiastic buying.
3. Providing a Long-Term Perspective
Bitcoin’s price can experience significant short-term fluctuations. However, the Rainbow Indicator smooths out this volatility using a logarithmic scale, emphasizing long-term trends. This is particularly valuable for long-term investors adopting a “HODL” strategy.
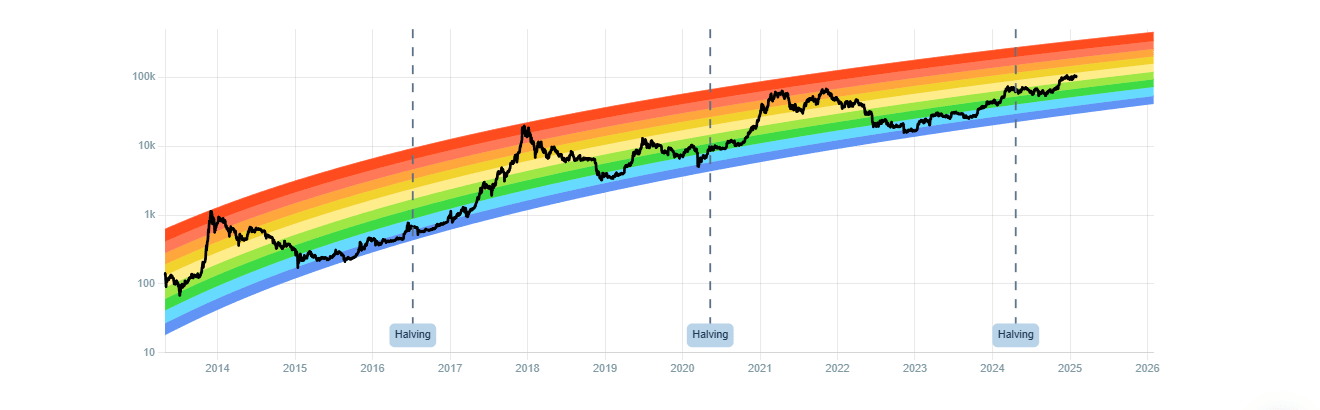
4. Connection with Bitcoin Halving
The Rainbow Indicator can also be linked to Bitcoin’s halving events, which occur every four years. Halving reduces Bitcoin mining rewards by half, decreasing supply and often impacting price over the long term. The indicator shows how price movements have historically unfolded after halvings, offering investors additional context. For instance, post-halving prices often start in the blue or green bands and may move toward higher bands over time.
How to Use the Rainbow Indicator?
To effectively use the Rainbow Indicator, follow these steps:
- Identify the Current Price Band:
Examine the chart to determine which color band Bitcoin’s current price falls into. For example, if the price is in the blue band, it may indicate a buying opportunity. - Interpret the Colors:
Learn the meanings of the color bands. Cool colors (blue, green) generally suggest buying opportunities, while warm colors (orange, red) signal selling or caution. - Analyze Historical Trends:
Study how the market reacted when the price was in the same band in the past. This can provide clues about potential future movements. - Combine with Other Indicators:
Instead of relying solely on the Rainbow Indicator, complement it with other technical indicators like RSI, MACD, or the Bitcoin Stock-to-Flow (S2F) model. This strengthens decision-making. - Stay Informed About Market News:
External factors such as macroeconomic events, regulations, or technological developments can impact prices. Evaluate the indicator within this context.
Disclaimer: This content is for informational purposes only and is not investment advice. Cryptocurrency investments carry high risks. Always conduct your own research and consider your risk tolerance when making investment decisions.
You can also freely share your thoughts and comments about the topic in the comment section. Additionally, don’t forget to follow us on our Telegram, YouTube, and Twitter channels for the latest news and updates.