


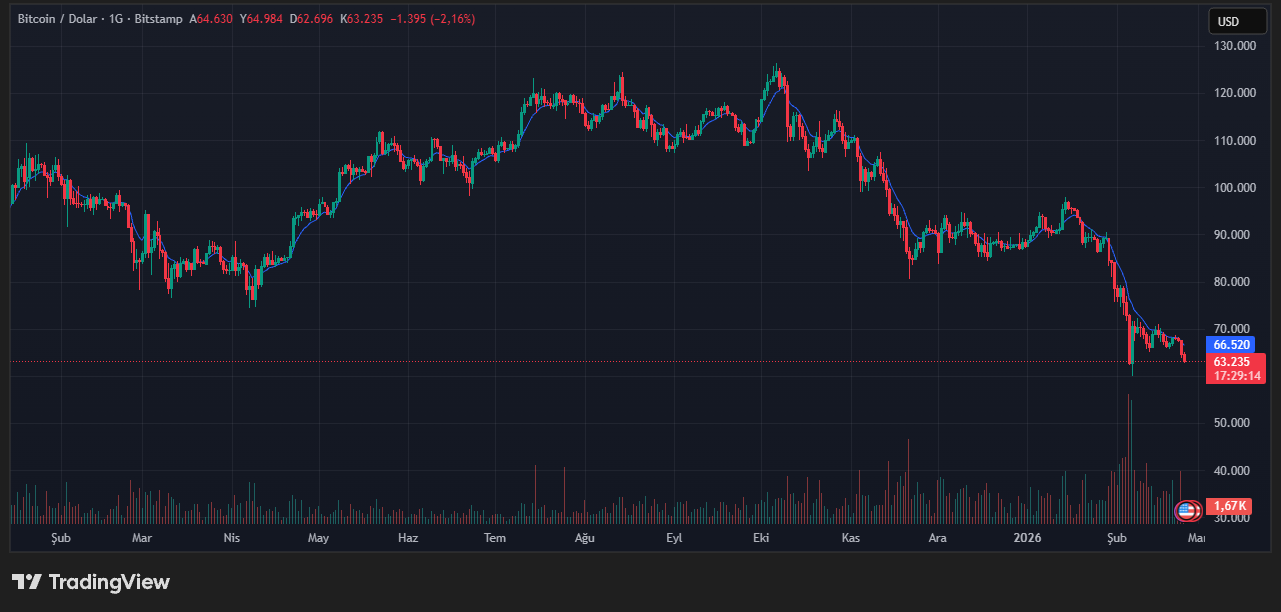
Bitcoin (BTC) slipped below the $63,000 mark during Asian trading hours, extending the weakness that began overnight. The leading cryptocurrency is now down roughly 7% on a weekly basis, returning to price levels last seen on February 6, when it briefly approached the $60,000 zone.
The recent pullback appears to be driven by two primary factors: renewed tariff announcements from United States President Donald Trump and a broader sell-off in artificial intelligence-related equities. The deterioration in risk appetite has not been confined to digital assets; traditional equity markets have also come under pressure.
Tariffs and Geopolitical Tension Weigh on Risk Assets
Following the Supreme Court’s rejection of his earlier tariff strategy, President Trump announced a temporary 15% tariff on imports, revising the previously stated 10% rate. The policy shift has intensified uncertainty around global trade conditions, injecting fresh volatility into financial markets.
At the same time, escalating geopolitical tensions are adding another layer of caution for investors. In this environment, Bitcoin is behaving similarly to other high-beta assets. Market observers highlight the $60,000 level as a critical technical support. A decisive break below that threshold could open the door to a deeper retracement toward the $50,000–$55,000 range.
What Historical Patterns Suggest
Looking at previous market cycles, one technical signal stands out: the so-called “bear cross,” which occurs when the 50-week moving average falls below the 100-week moving average. In both the 2018 and 2022 bear markets, this crossover coincided with the final stages of the downturn.
Currently, however, the 50-week average remains above the 100-week average. From a historical perspective, that suggests the corrective phase may not yet be complete. It is important to remember that moving averages are lagging indicators; they confirm trends that have already unfolded rather than predict future turning points.
Short-Term Risks Remain
While no historical pattern guarantees future outcomes, the combination of macroeconomic uncertainty and the current technical structure indicates that additional downside cannot be ruled out. Whether Bitcoin can defend the $60,000 level will likely determine the market’s next directional move.
This content is not investment advice. Cryptocurrency markets are highly volatile, and individuals should conduct their own research before making financial decisions.
You can also freely share your thoughts and comments about the topic in the comment section. Additionally, don’t forget to follow us on our Telegram, YouTube, and Twitter channels for the latest news and updates.