


Bitcoin has fallen below the True Market Mean, entering a defensive range toward the Realized Price (~$54,900). Glassnode’s latest on-chain data shows this breakdown is more than a short-term deviation. The market is no longer in a clear uptrend. Instead, it is trying to stabilize. Demand remains weak, ETF flows have turned negative, and there is still no clear signal that large investors have returned with strong conviction.
In periods like this, price usually does not search for direction immediately. It searches for a floor first.
Loss of $79,000 shifted market structure into defense
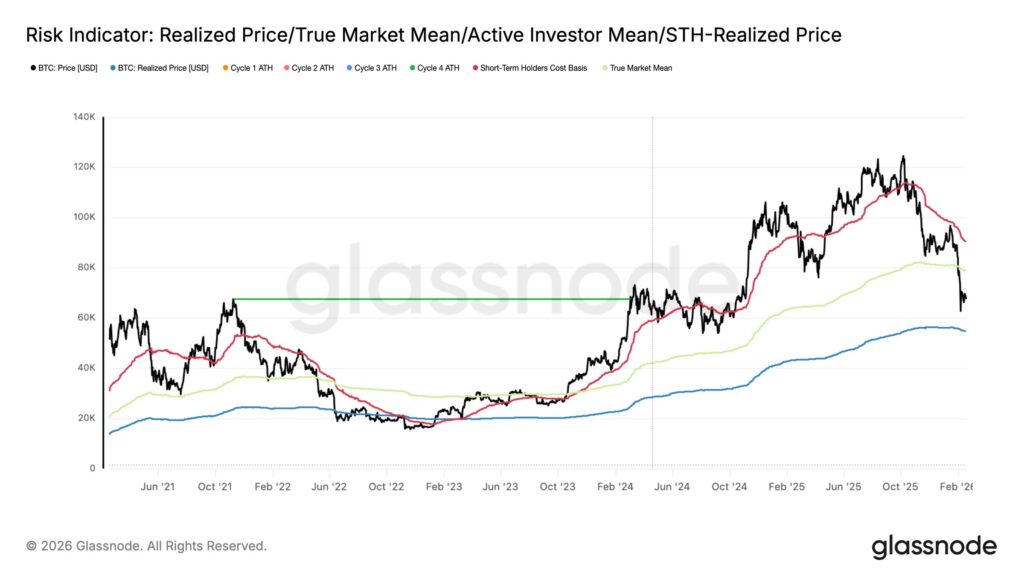
The True Market Mean represents the average cost basis of the active BTC supply and currently sits near $79,000. Falling below this level means the average investor cost basis is now above market price. This shift is not only technical, but behavioral.
In previous cycles, similar breakdowns were followed by extended consolidation phases moving toward the Realized Price. Today, that level stands near $54,900. This metric reflects the average acquisition cost of all circulating Bitcoin and is widely considered a long-term structural equilibrium level.
As a result, the current structure is defined between two key reference points: $79,000 as resistance and $54,900 as structural support. Medium-term market behavior is now largely forming within this corridor.
$60,000–$69,000 emerges as critical defense zone
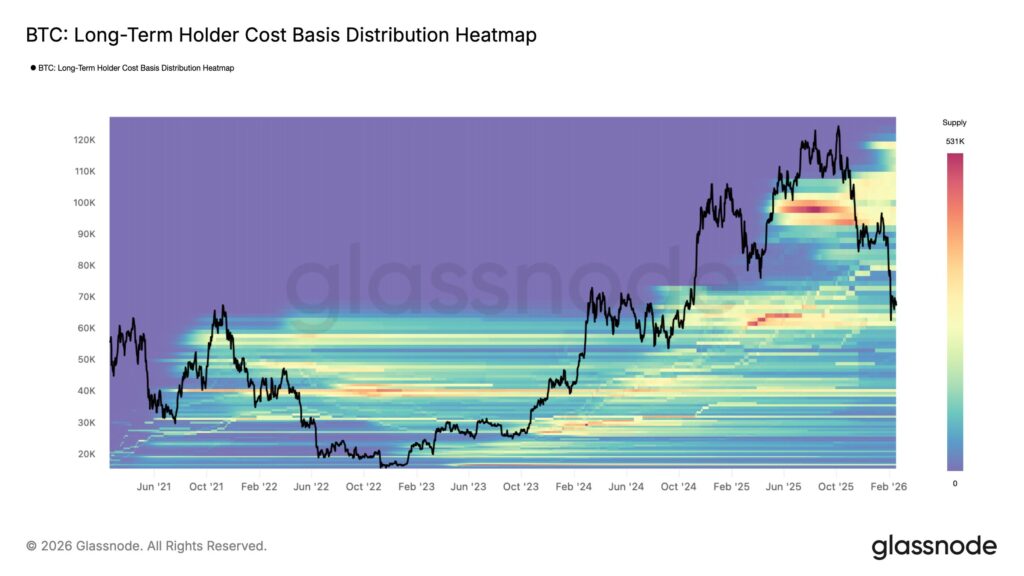
Glassnode’s cost basis distribution data shows heavy investor positioning between $60,000 and $69,000. This zone was established during the consolidation phase in the first half of 2024, and most positions from that period remain intact.
This creates an important stabilization mechanism. Investors tend to avoid aggressive selling near their cost basis. That behavior slows downside momentum.
Recent price action confirms this structure. Selling pressure continues, but there is no uncontrolled breakdown. Instead, the market is transitioning into a sideways consolidation phase.
Accumulation exists, but strong buying has not returned
The Accumulation Trend Score provides clearer insight into investor behavior. This metric had previously fallen below 0.1, reflecting strong distribution. Recent readings show a recovery to approximately 0.43.
This indicates that selling pressure has eased. However, strong accumulation phases typically begin when this metric rises above 0.8. Current levels suggest a neutral balance rather than aggressive accumulation.
In simple terms, investors have stopped selling aggressively. But they have not started buying aggressively either.
This explains why the market has not yet produced a strong recovery.
ETF outflows increase structural pressure
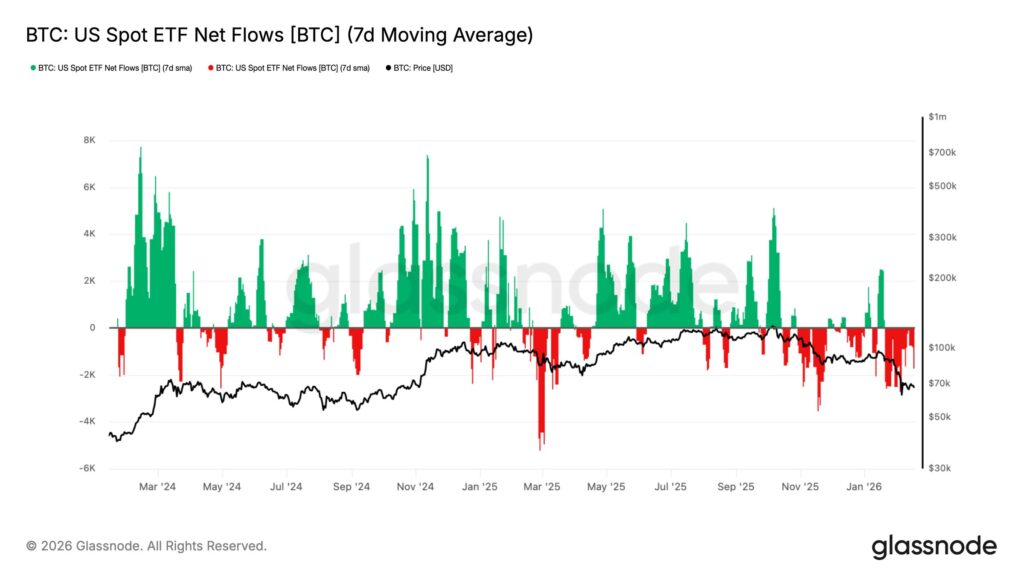
Institutional demand has also weakened. Net flows across spot Bitcoin ETFs have turned negative again. What previously acted as consistent structural support has shifted into net outflows.
Spot market data shows a similar pattern. The Cumulative Volume Delta indicator confirms that sell-side pressure remains dominant. This reflects limited organic buying strength.
In environments like this, price typically moves sideways rather than upward, as sustained demand is required to support a strong rally.
Panic fades in derivatives market
Options market data shows that volatility levels have declined, indicating that the panic phase has largely passed. The drop in implied volatility suggests that expectations of an immediate crash have eased.
However, this does not signal renewed bullish conviction. Funding rates and derivatives positioning still reflect cautious sentiment.
The market is no longer in panic mode. But confidence has not returned either.
Bitcoin is searching for balance as direction remains unclear
Taken together, Glassnode data shows Bitcoin is currently in a transition phase. The loss of the True Market Mean weakened structural positioning. ETF outflows and weak spot demand continue to limit recovery.
At the same time, selling pressure has not become disorderly. The $60,000–$69,000 range continues to function as a key stabilization zone.
For a sustained recovery to develop, three conditions will likely be required: stronger spot demand, renewed ETF inflows, and clear accumulation from large investors.
Until those conditions emerge, Bitcoin is likely to continue moving within the defensive range defined between approximately $54,900 and $79,000, which remains the dominant structural framework according to current on-chain data.
You can also freely share your thoughts and comments about the topic in the comment section. Additionally, don’t forget to follow us on our Telegram, YouTube, and Twitter channels for the latest news and updates.