What is the current situation with Bitcoin and popular altcoins? Will the upward trend continue? What are the important support and resistance levels? Liquidations, the coins with the most increases and decreases, upcoming events, and other details are prepared for you!
Key Intraday Levels for Bitcoin
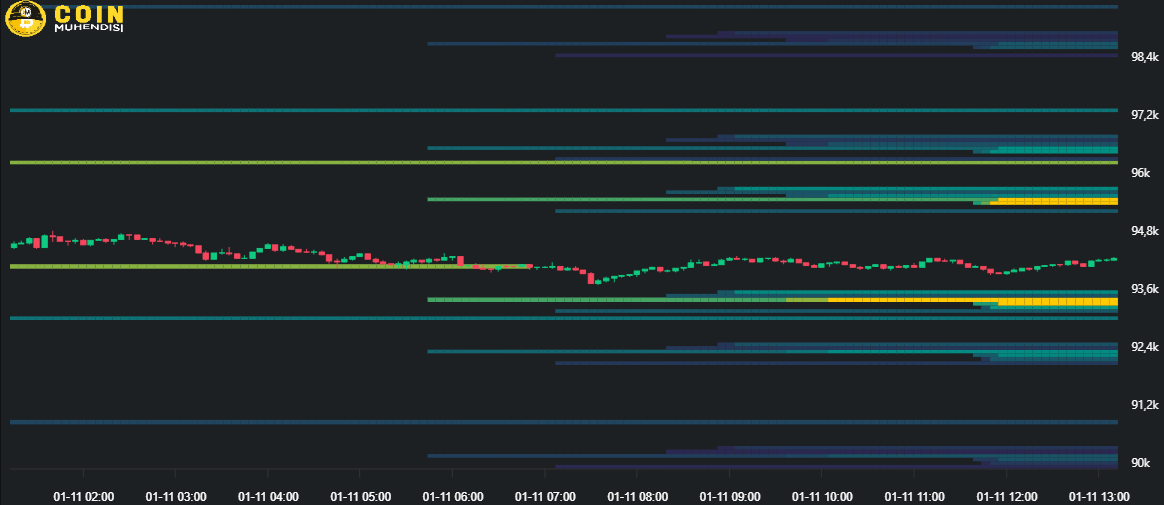
Bitcoin is still moving sideways in the range of $94,000–$95,000. While the market was low in volume over the weekend, a small upward movement could occur as seen in previous cycles. Currently, the support area is that we must not close below $93,600 on the hourly chart. If it can break above the $96,000 level, the possibility of reaching $99,600 on the hourly chart is quite high.
In case of an upward movement, the resistance level is $96,800. The second resistance level is $102,600. The support levels are $92,000 and $90,000, respectively.

Ethereum (ETH): The ETH/USDT pair has lost 0.67% in the last 24 hours and is currently trading at $3245. The resistance levels for ETH are first $3320 and then $3560. The support levels are $3200 and $2800.
Open Campus (EDU): The EDU/USDT pair has lost 2.32% in the last 24 hours and is currently trading at $0.5262. The resistance levels for EDU are first $0.58 and then $0.67. The support levels are $0.50 and $0.40.
Render (RENDER): The RENDER/USDT pair has lost 1.59% in the last 24 hours and is currently trading at $7.177. The resistance levels for RENDER are first $8 and then $9.80. The support levels are $6.90 and $5.70.
BNB (BNB): The BNB/USDT pair has gained 0.26% in the last 24 hours and is currently trading at $694.88. The resistance levels for BNB are first $700 and then $780. The support levels are $675 and $600.
Trend Coins
In the last 24 hours, the most trending coins in the crypto market include Pippin (PIPPIN), AI16Z (AI16Z), and Usual (USUAL). Among the biggest gainers are INSURANCE (INSURANCE), Bitcoin SV (BSV), and Bitget Token (BGB). On the list of the biggest losers in the market, AI16Z (AI16Z), Swarms (SWARMS), and Fartcoin (FARTCOIN) are found.

Bitcoin Liquidation Map
Looking at the 12-hour liquidation map of Bitcoin, the notable liquidation on the upper side is at the $95,020 level with $19.38 million. On the lower side, the $93,269 level stands out with $18.27 million.

You can also freely share your thoughts and comments about the topic in the comment section. Additionally, don’t forget to follow us on our Telegram, YouTube, and Twitter channels for the latest news and updates.


