Volatility continues in the cryptocurrency market. Both Bitcoin and Ethereum are moving around key support and resistance zones, drawing the attention of investors. Technical indicators and price formations suggest that critical breakouts may be imminent.
Bitcoin (BTC) Technical Analysis
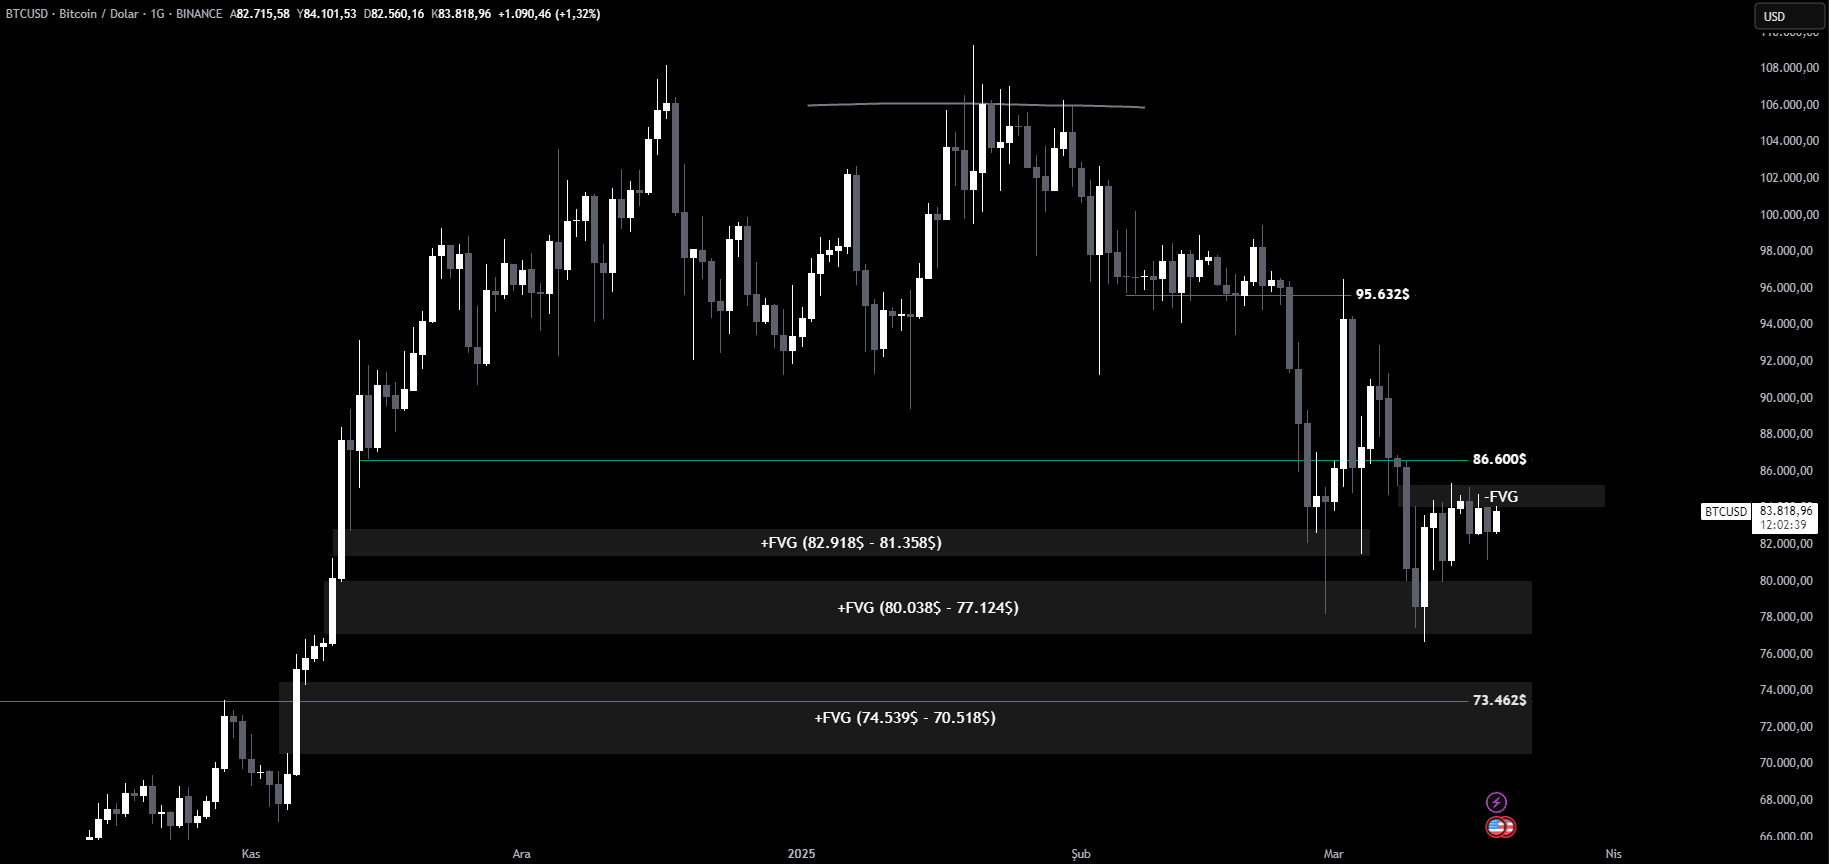
On the daily chart, Bitcoin continues to fluctuate within the bearish FVG zone identified in previous analyses. The lack of a clear rejection signal from this region indicates that traders considering long positions should exercise caution.
- If the price breaks above this area, the target level is 86,600 dollars.
- Conversely, if selling pressure increases, the first support level to watch will be 80,038 dollars, coinciding with the bullish FVG zone, which could serve as a potential recovery point.

You Might Be Interested In: Elon Musk Talks About the Name of a New Memecoin!
Ethereum (ETH) Technical Analysis
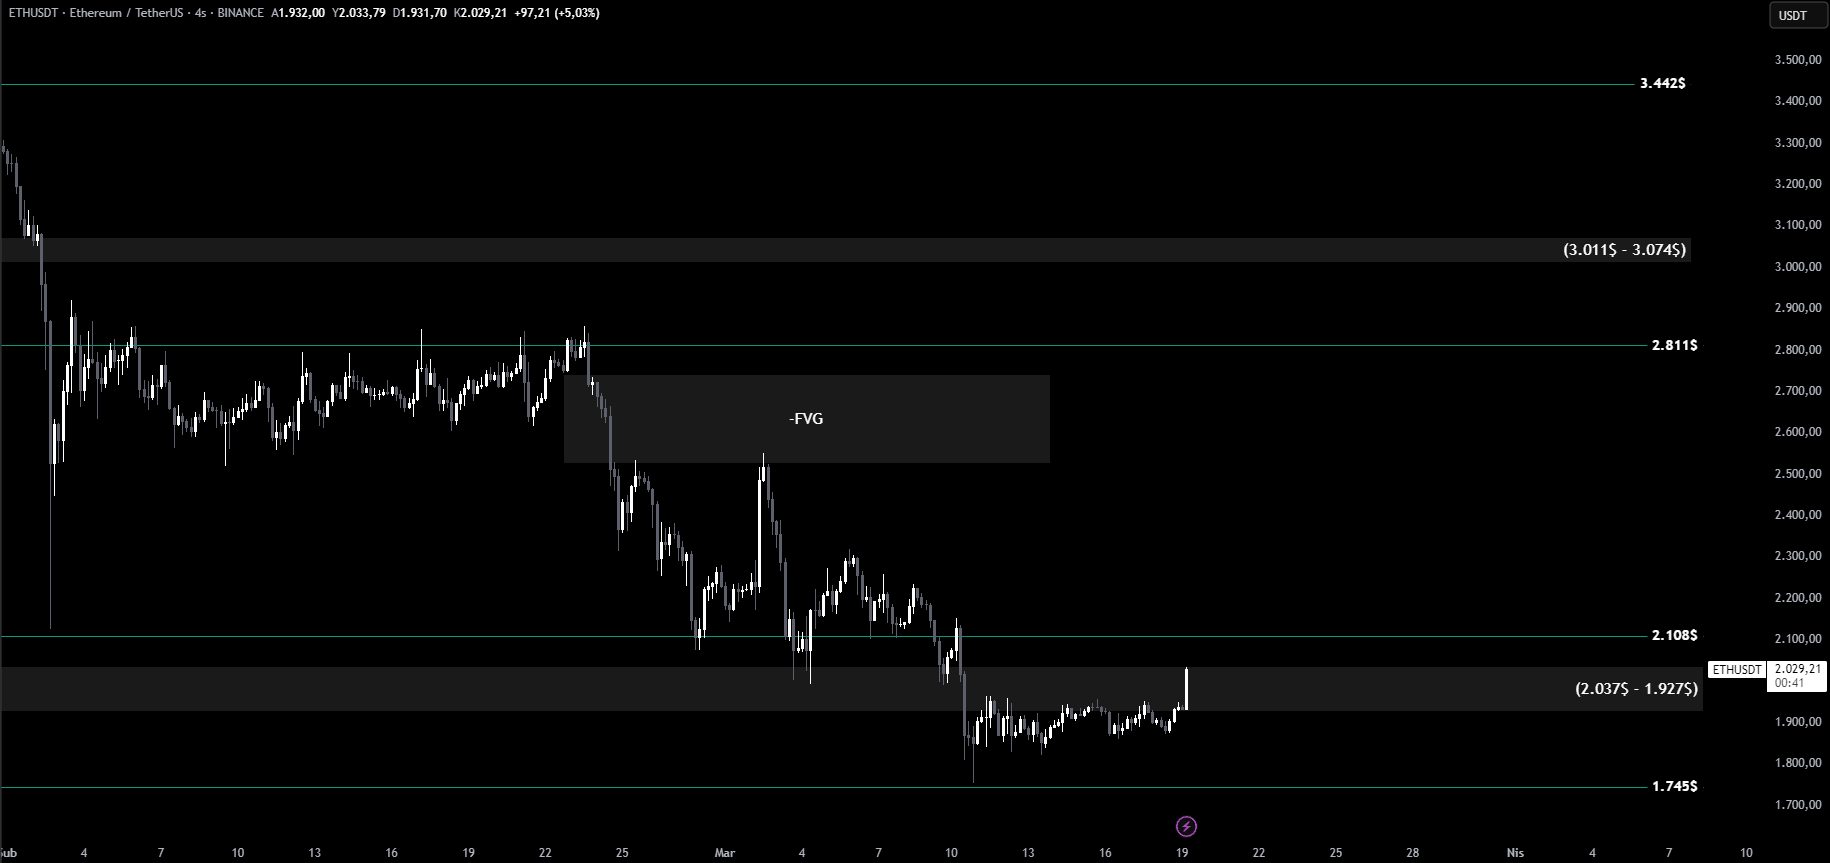
Ethereum is attempting to hold the support zone we highlighted in previous analyses. Consistent daily closes above this level could open the path toward 2,108 dollars.
- If 2,108 dollars is reclaimed, we may witness a swift move toward the 2,200 – 2,300 dollar range.
- However, if support fails and downward pressure persists, the price could decline back to 1,745 dollars, representing the next major support zone.

Both Bitcoin and Ethereum are trading at significant price levels. Movements within FVG zones and key support-resistance areas will determine the short-term market direction. Monitoring closing prices and trading volumes is essential for informed decision-making.
You can also freely share your thoughts and comments about the topic in the comment section. Additionally, don’t forget to follow us on our Telegram, YouTube, and Twitter channels for the latest news and updates.


