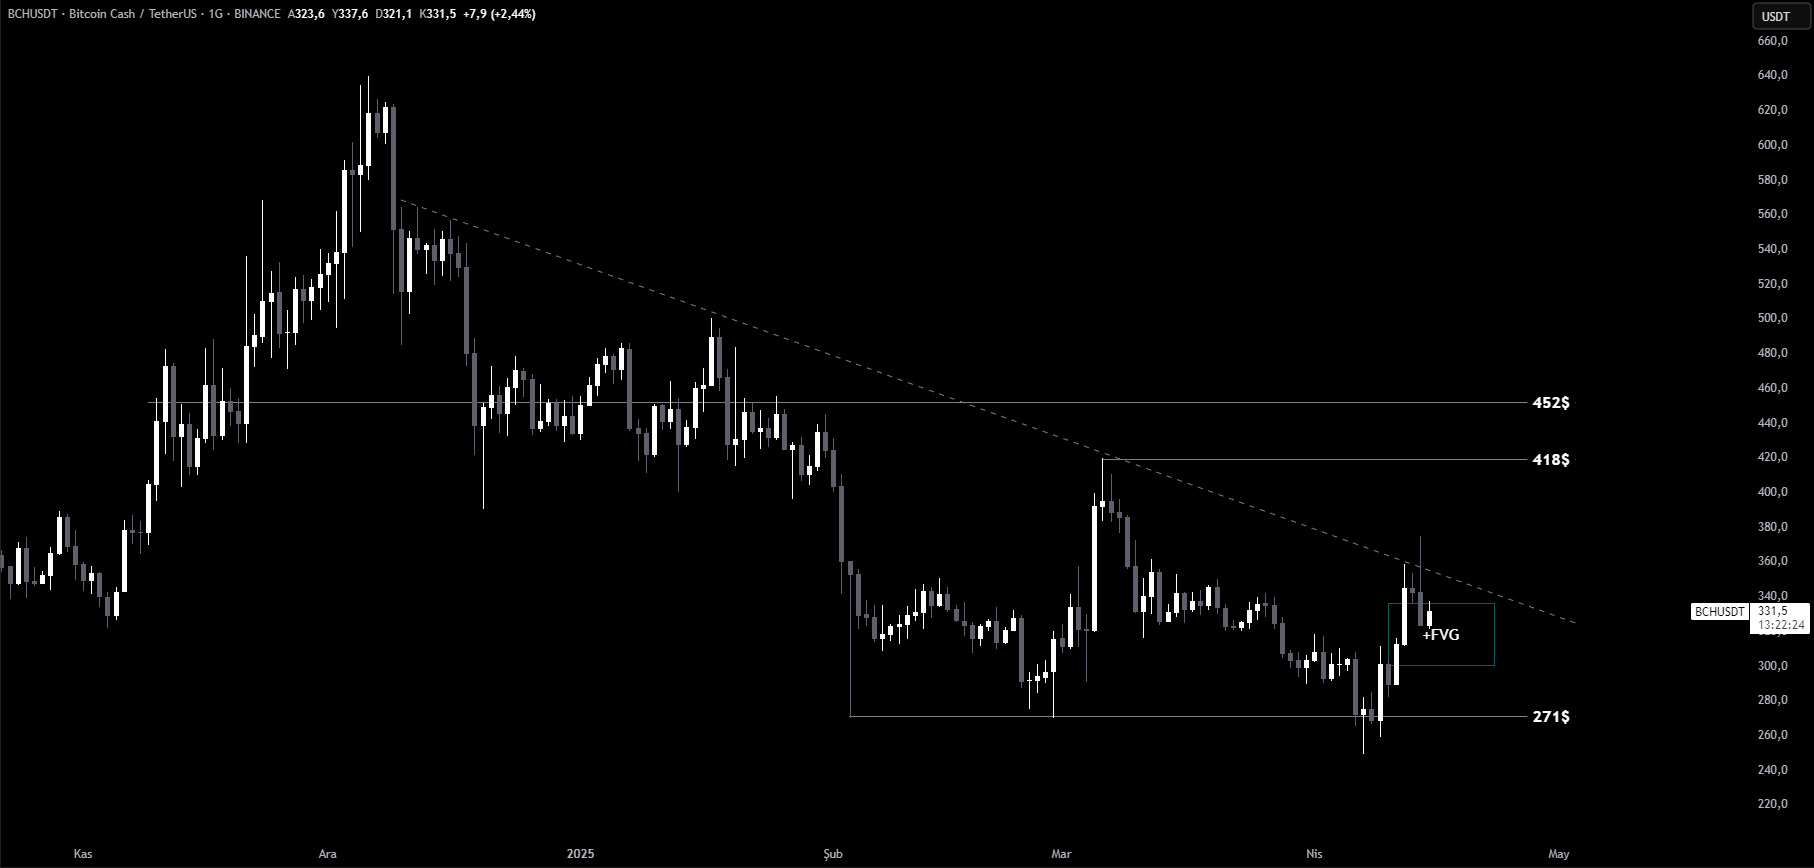
Bitcoin Cash (BCH) continues to follow its downward trendline on the daily chart. The price has once again faced rejection from the descending trend and pulled back into a bullish Fair Value Gap (FVG) — a critical support zone.
Key Support: Bullish FVG Area
This support zone acts as an area of previously inefficient price action, where buyers may potentially step in. If this zone is lost to the downside, the next major support lies at $271, which aligns with historical reaction levels.
Breakout Scenario
If BCH receives a bullish reaction from this zone and manages to break the downtrend with strong volume, the first target will be $418 — a significant pivot zone that has acted as support/resistance in the past.
You Might Be Interested In: Elon Musk Talks About the Name of a New Memecoin!
A sustained move above $418 would open the door toward the next key resistance at $452, which has historically triggered major sell-offs.

BCH is currently trading at a pivotal technical zone. A breakdown could lead to further correction toward $271, while a breakout may initiate a trend reversal toward higher resistance levels. Traders should stay alert and prioritize risk management.
You can also freely share your thoughts and comments about the topic in the comment section. Additionally, don’t forget to follow us on our Telegram, YouTube, and Twitter channels for the latest news and updates.


