According to the latest Bitcoin market analysis, BTC’s price strength will face its real test at $102,000, and this level needs to flip to support.
Despite reclaiming $100,000, Bitcoin may still face a “likely” rejection at a key level, according to new analysis. In a post on X platform on January 16, Stockmoney Lizards noted that BTC/USD has weeks of rangebound trading ahead.
$102,000: The “Toughest Nut to Crack” for BTC Price
Bitcoin bounced strongly this week from two-month lows, but according to Stockmoney Lizards, the bulls are not out of the woods yet.
The analysis, examining short-term BTC price action, concluded that despite fresh taps of the $100,000 mark, the real resistance zone is slightly higher up and is not ready to break yet.
“BTC is entering a resistance zone (upper channel level),” the analysis stated, alongside a 4-hour chart. It highlighted that the 91-92k range is a high-volume lower support level (1.618 Fibonacci Extension), and that $102k will be the “toughest nut to crack” as a previous high.

BTC/USDT 4 Hour Chart
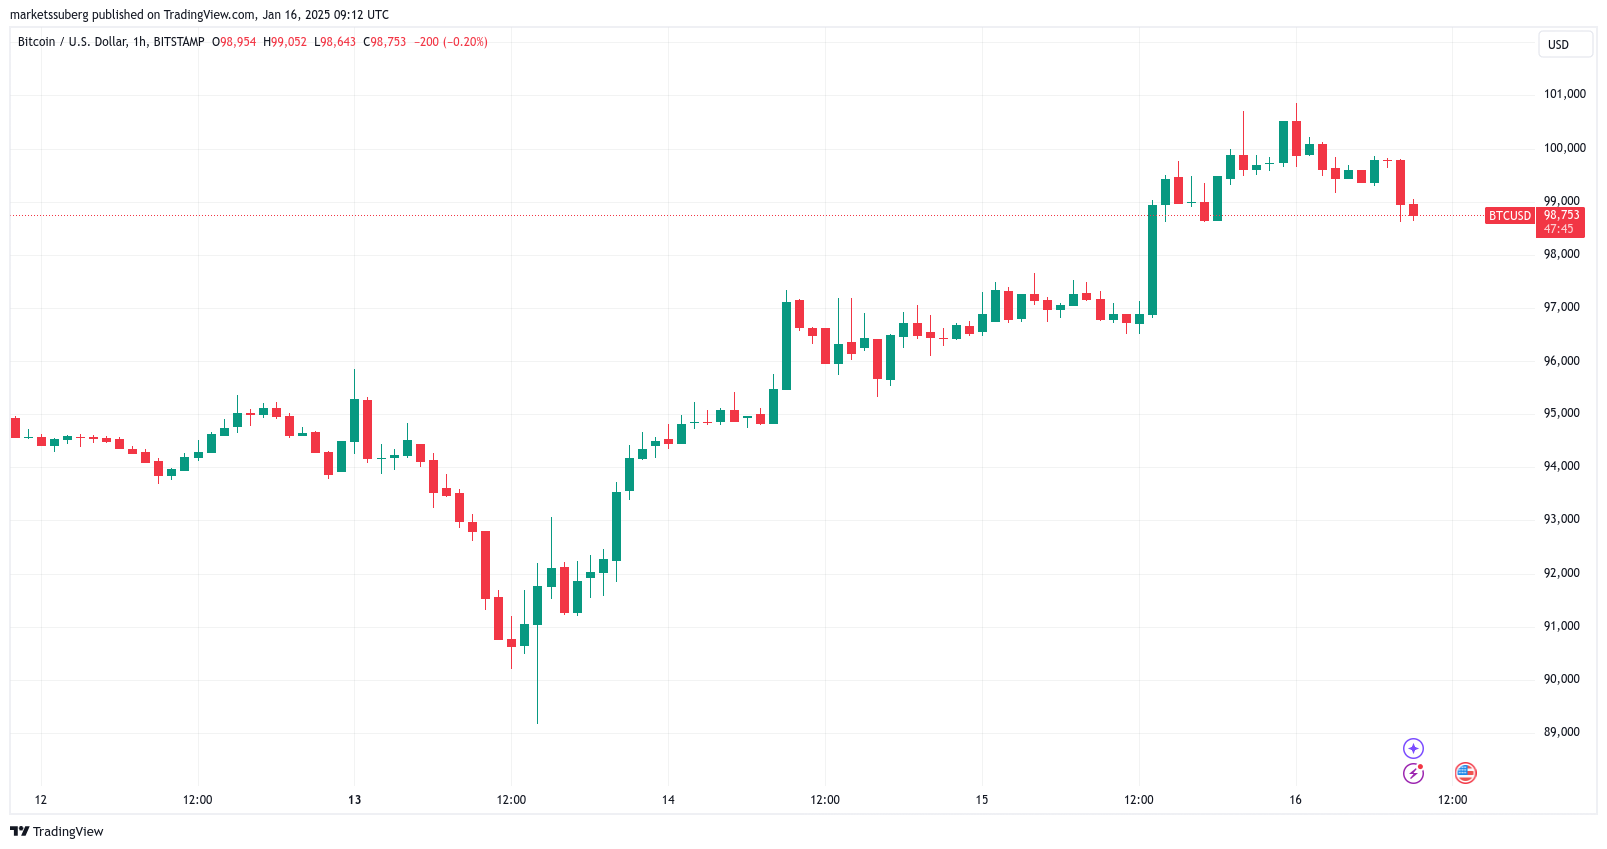
According to TradingView data, BTC/USD was trading around $99,000 at the time of writing and continued to be supported by positive US inflation reports.
However, despite the upcoming presidential inauguration, Stockmoney Lizards saw little chance of a genuine bull market comeback in January.
“A rejection from here is likely, we expect BTC to continue trading in the 90-100k range in the next weeks,” it summarized.

BTC/USDT Hourly Chart
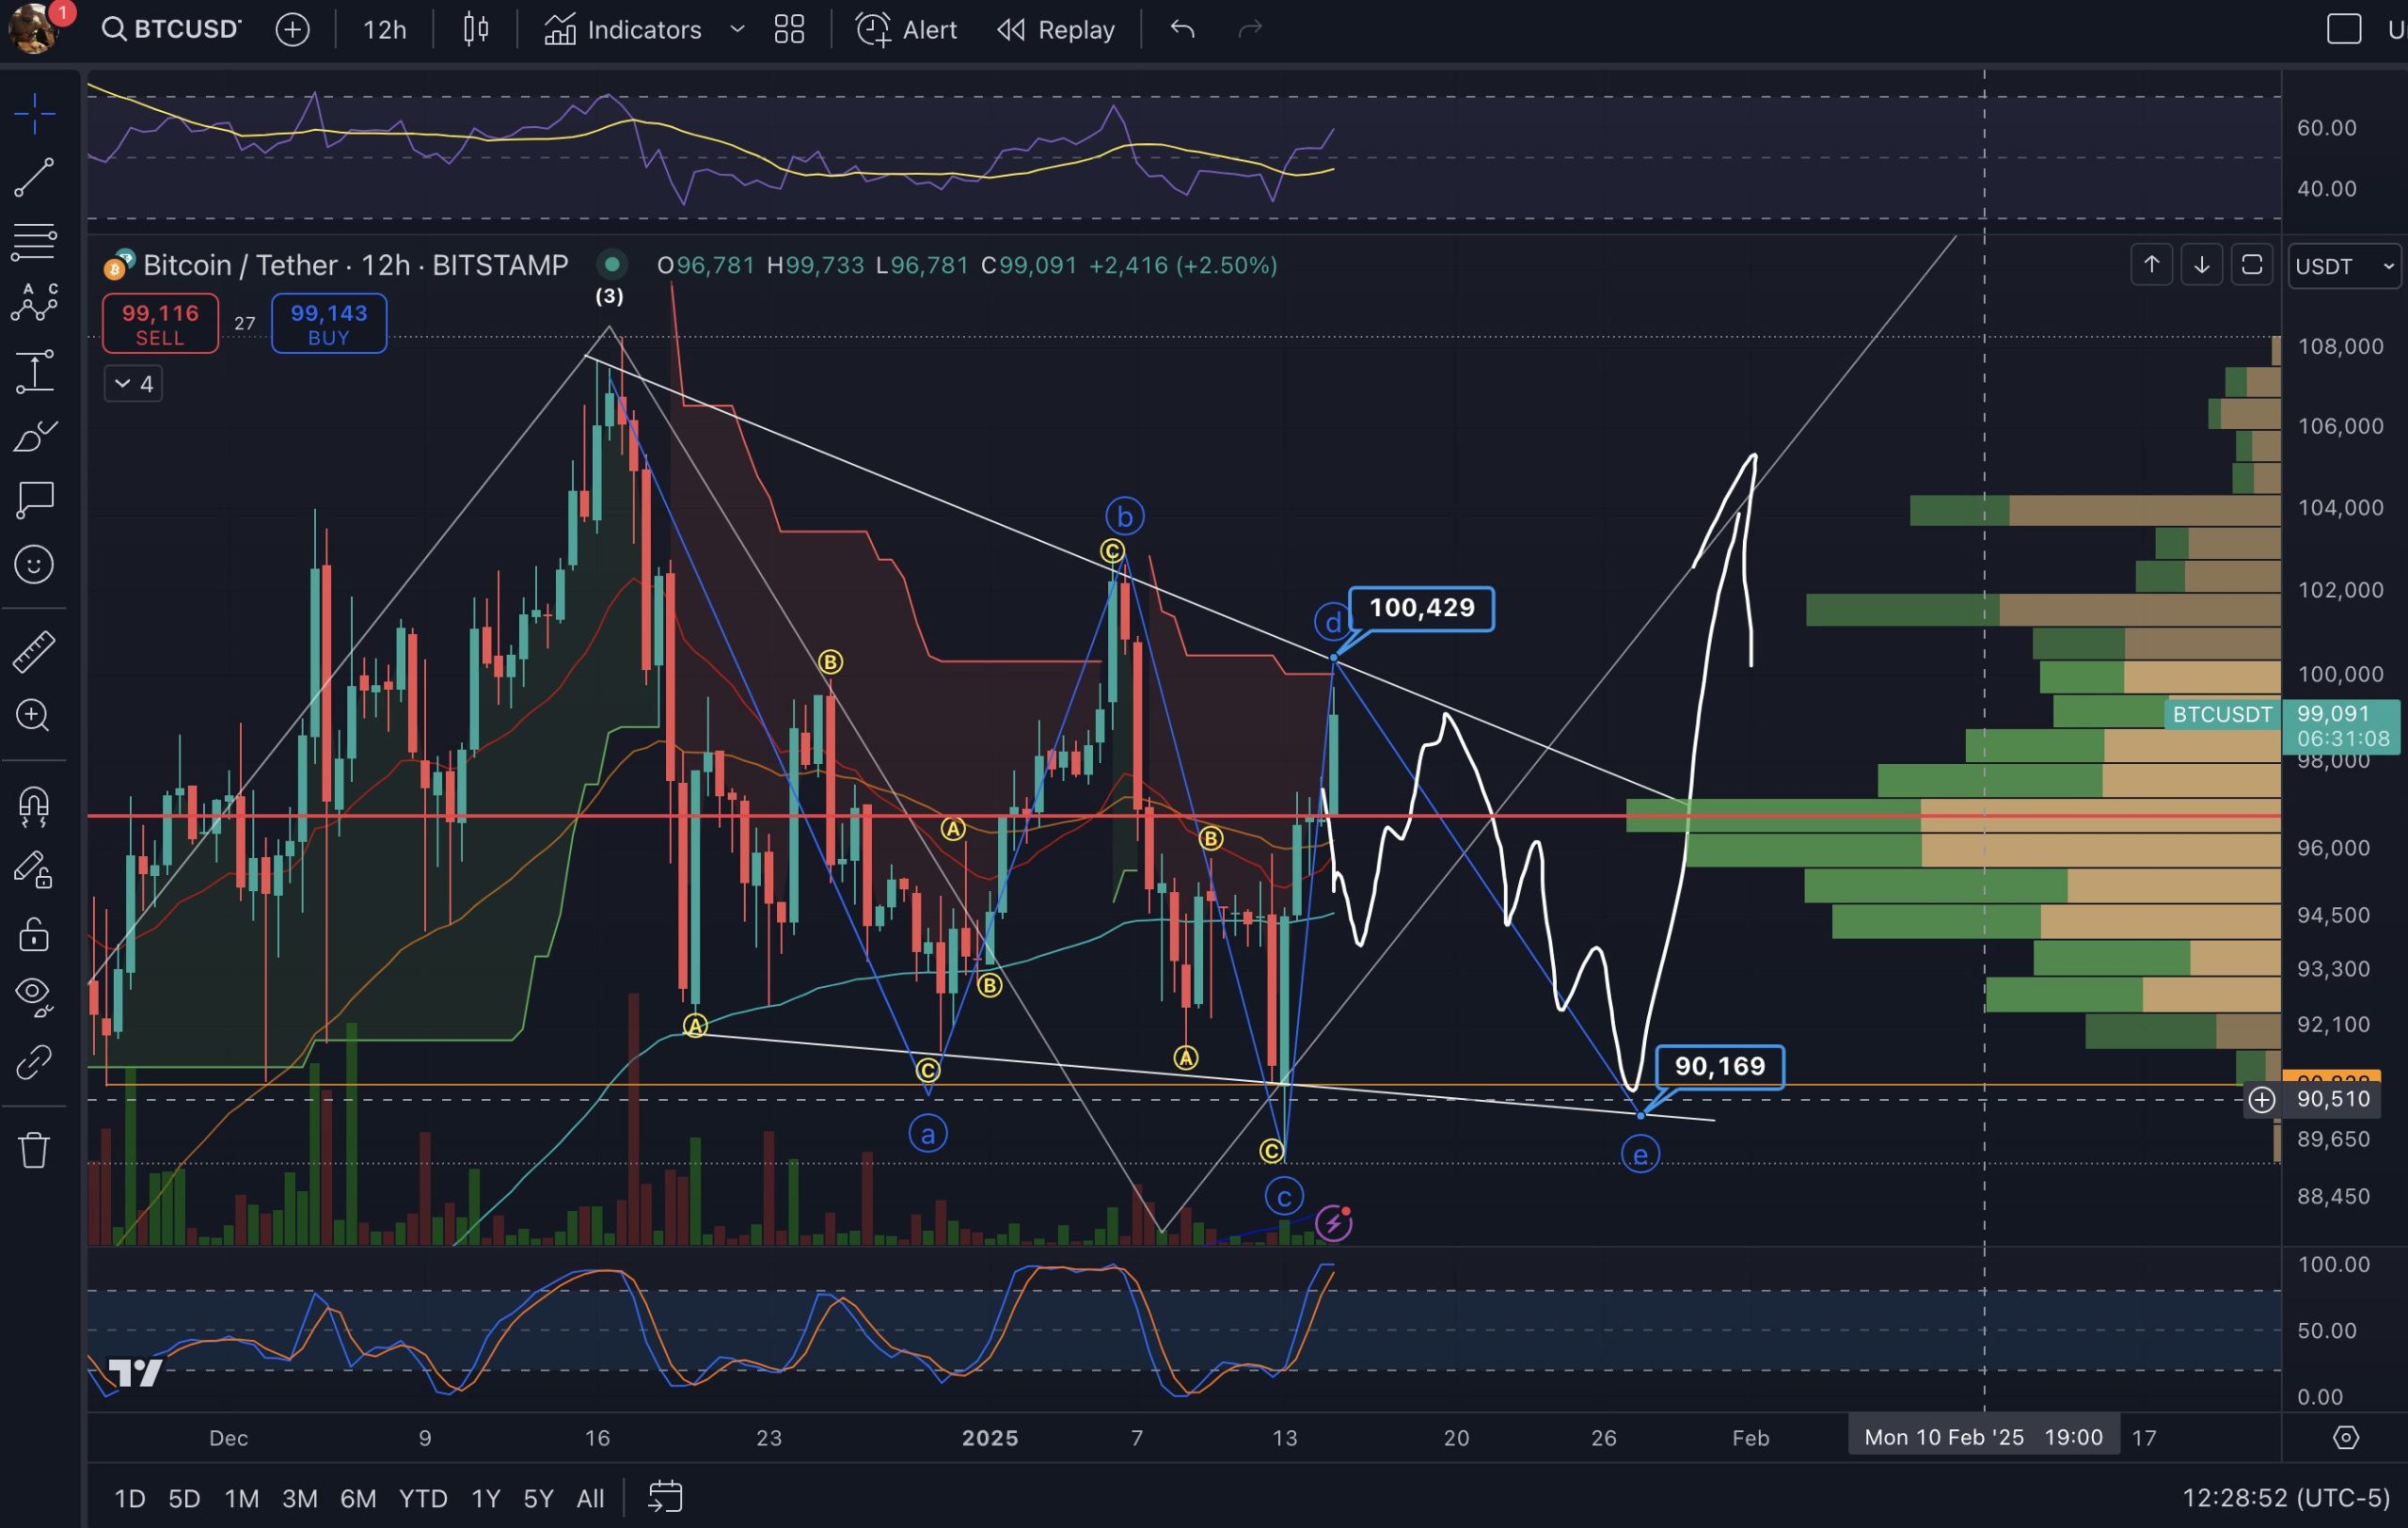
Other analysts also pointed out similar difficulties with the $102,000 level, including the popular X trading account BigMike7335.
“$BTC must flip $102k into support to remove us from the threat of the triangle IMO,” the account stated, sharing a chart with various trading indicators, focused on 12-hour timeframes.

BTC/USDT 12 Hour Chart
Bitcoin Investors Call Time on Bearish Pattern
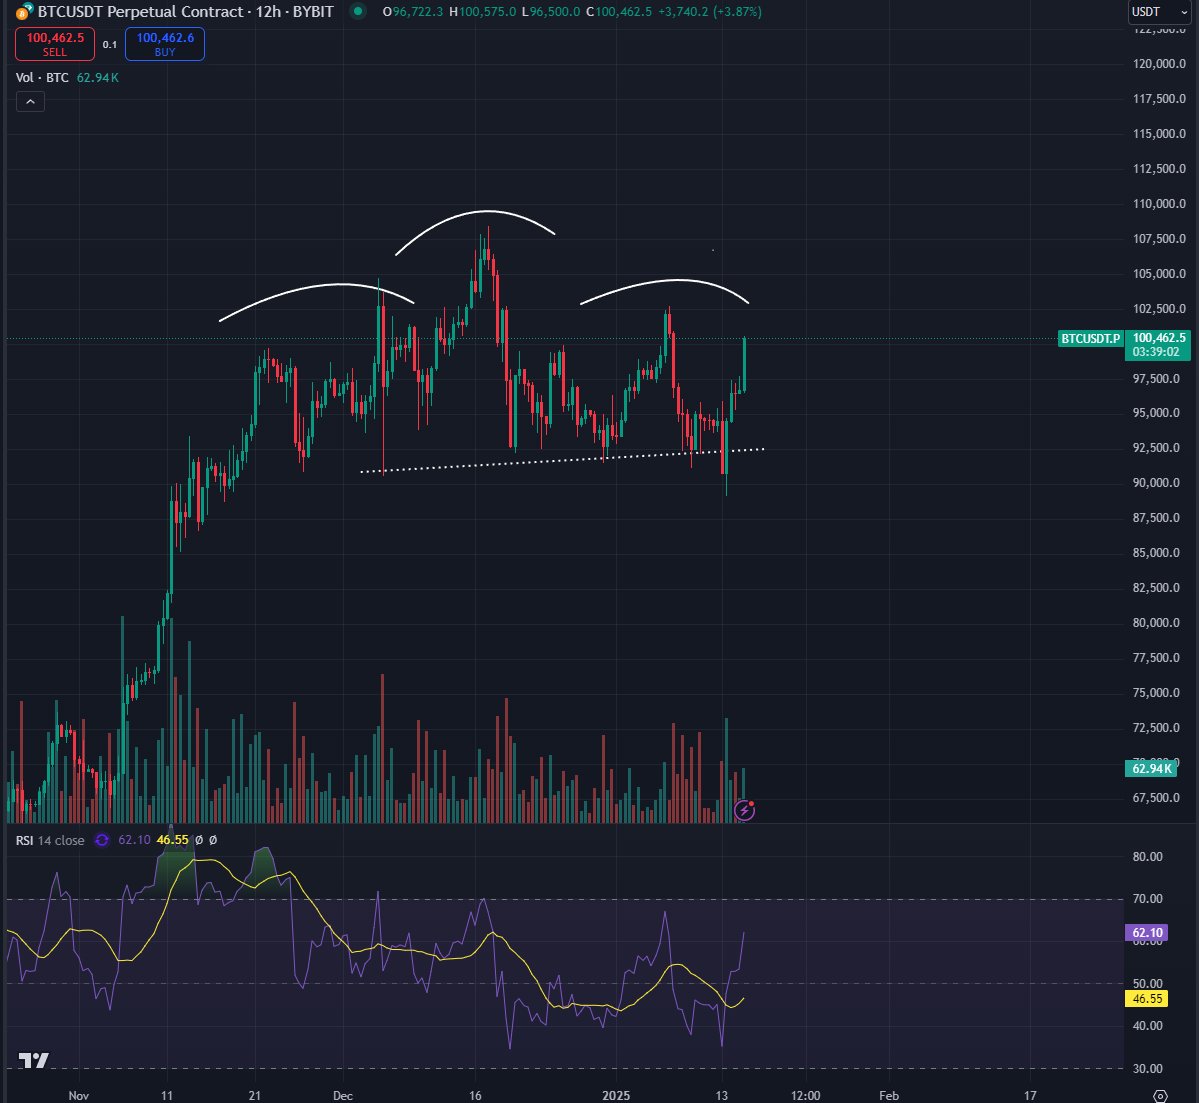
More optimistic views focused on the invalidation of the bearish head and shoulders trend reversal pattern on the daily chart.
“And just like that, head and shoulder breakdown sellers completely and utterly rekt,” announced fellow trader Bluntz to his followers on X platform.

BTC/USDT Perpetual Swaps 12 Hour Chart
For Tony “The Bull” Severino, this pattern had also become irrelevant.
“How many right shoulders need to fail before the market realizes this isn’t a head and shoulders top in Bitcoin?” he asked.
You can also freely share your thoughts and comments about the topic in the comment section. Additionally, don’t forget to follow us on our Telegram, YouTube, and Twitter channels for the latest news and updates.


