The weakness in BTC price had an immediate impact on the RSI, causing it to drop to “oversold” levels not seen since the beginning of October.
The Drop in BTC Price Sends RSI Back to October Levels
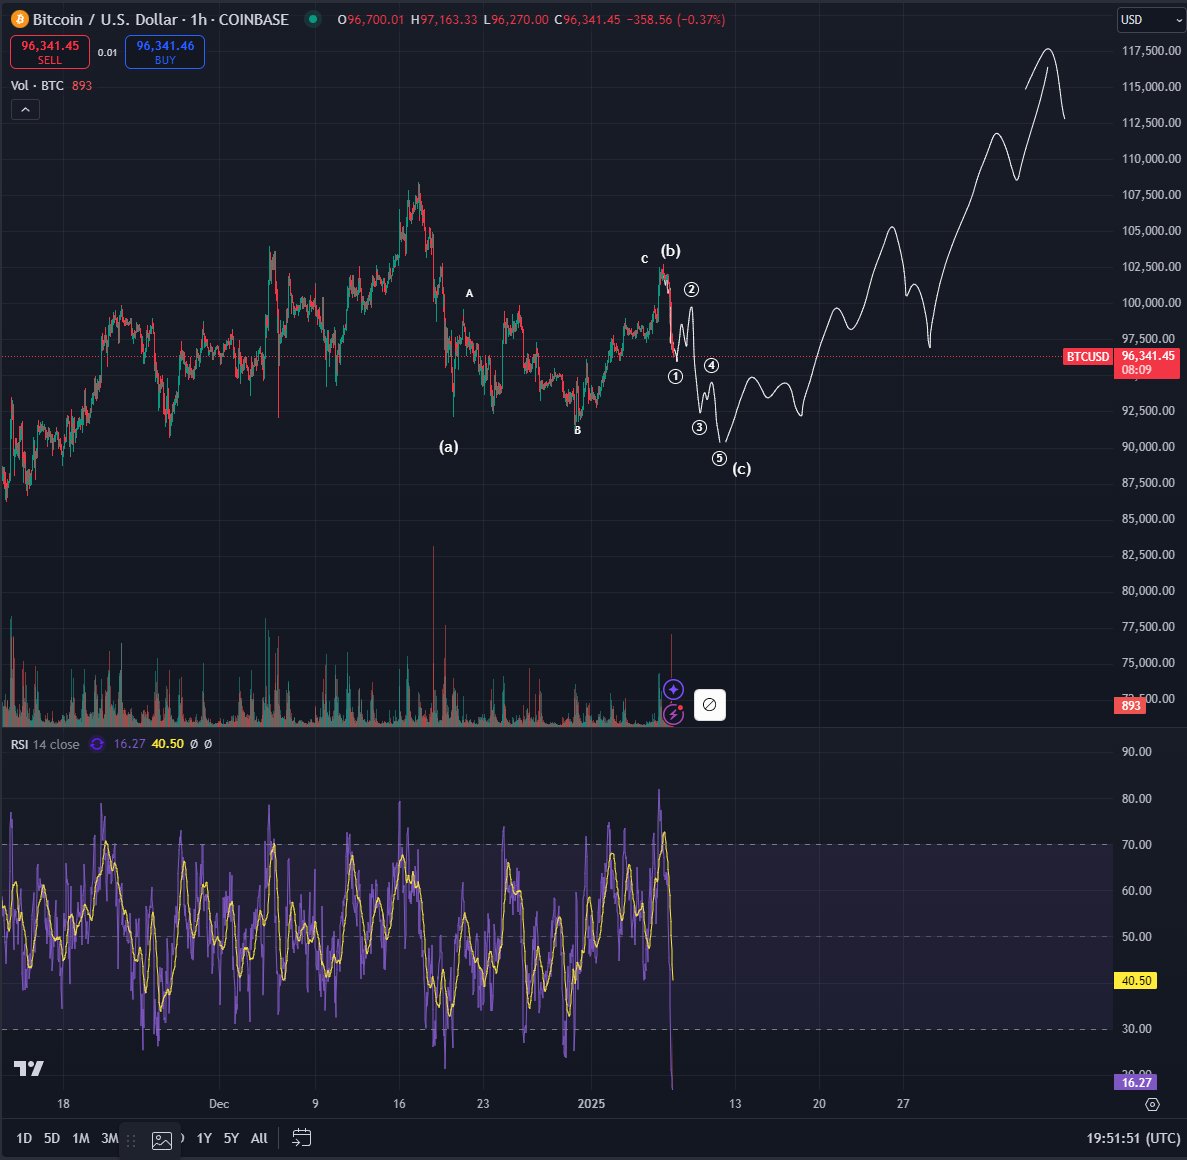
Bitcoin’s 5% drop in a single day had a significant impact on the RSI in lower timeframes. On the hourly chart, the RSI dropped from a local high of 81.7 on January 6 to a three-month low of 16.6 the following day.
Such a rapid decline is rarely seen; BTC/USD retraced from “overbought” to “oversold” levels within 24 hours. The last time the index measured this low, BTC/USD was trading at $60,000.

BTC/USD 1-Hour Chart With RSI Data
RSI is an indicator that measures trend strength and includes three key levels for observers: the 30 “oversold” boundary, the 50 midpoint, and the 70 “overbought” threshold.
When the price crosses these levels, depending on the direction, traders can make inferences about the future of a given uptrend or downtrend. During bull markets, Bitcoin often spends extended periods in the “overbought” territory.
With the recent decline, traders quickly predicted that the BTC price would experience an upward correction due to the RSI’s overreaction.
“The 1-hour Bitcoin RSI is at 16 and the 4-hour RSI is almost completely reset,” commentator Bitcoin Munger reported on the X platform while observing inflows to US spot Bitcoin exchange-traded funds (ETFs).
Despite making new local lows on January 8, RSI moved in the opposite direction of the spot price downtrend; this deviation is typically followed by price relief.
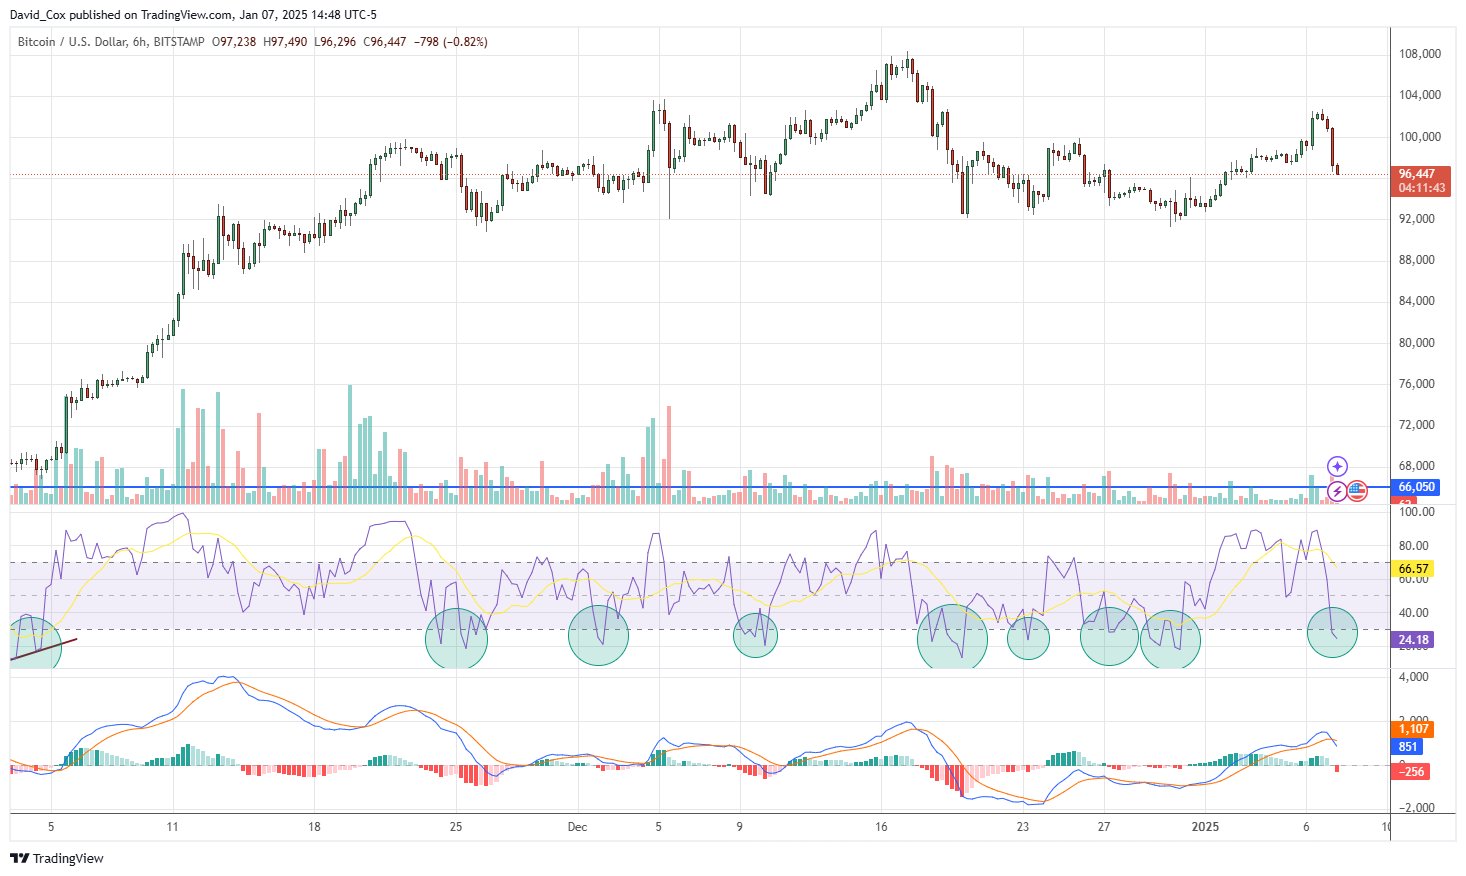
“Bitcoin #BTC $BTCUSD has reached the next RSI(5) oversold point on the 6-hour chart…” trader and portfolio manager David Cox continued, analyzing other low-timeframe RSI readings.

BTC/USD 6-Hour Chart With RSI Data
Bitcoin investors are expecting new lows in January, with bearish BTC price targets still circulating ahead of the inauguration of US President-elect Donald Trump.
These targets include a return to the range lows at or just below $90,000, along with deeper corrections to $80,000 or lower.
Adding to the downside forecasts, popular trader Bluntz used Elliott Wave Theory to predict new lows within the next two weeks.
A chart uploaded to the X platform implied that new all-time highs should result once the market rebounds.

BTC/USD 1-Hour Chart With RSI Data
You can also freely share your thoughts and comments about the topic in the comment section. Additionally, don’t forget to follow us on our Telegram, YouTube, and Twitter channels for the latest news and updates.


