We will analyze past price movements through Bitcoin price analysis, charts, and technical indicators. We will identify support and resistance levels and guide investors in making trading decisions.
Bitcoin, with a sharp decline yesterday, dropped to levels around $43,190. However, with the positive atmosphere in the market following today’s ETF news, it started to rise again and surpassed the $47,000 price tag.
The drop yesterday caused uncertainty in the market. However, today’s Exchange-Traded Fund (ETF) news increased investor confidence and revived demand for Bitcoin. With these positive developments, the Bitcoin price quickly recovered and reached levels around $47,000.
Fluctuations in the cryptocurrency markets usually occur based on news and the general atmosphere in the market. Investors can quickly react to market developments by closely monitoring the news flow.
However, changes in cryptocurrency prices are generally based on volatility and involve risks for investors. Therefore, it is important to conduct thorough research and stay updated on current developments before investing in the market.

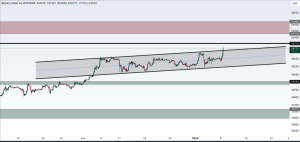
The upward breakout of the rising channel formation by Bitcoin today represents a significant development. The average target determined points to the $51,000 level, but before reaching this point, it needs to break above and strengthen the $48,235 resistance level.
During this process, as the price approaches the $51,000 level, it should be considered that a potential risky zone may be entered. Therefore, it is believed to be important to take profit as the price rises. Additionally, it should be noted that the “sell the news” event following the ETF approval could trigger significant selling.
Looking at the lower side in the chart analysis, support levels between $45,000 and $40,750 stand out. These levels can be considered as areas where the price may hold in case of possible corrections.


