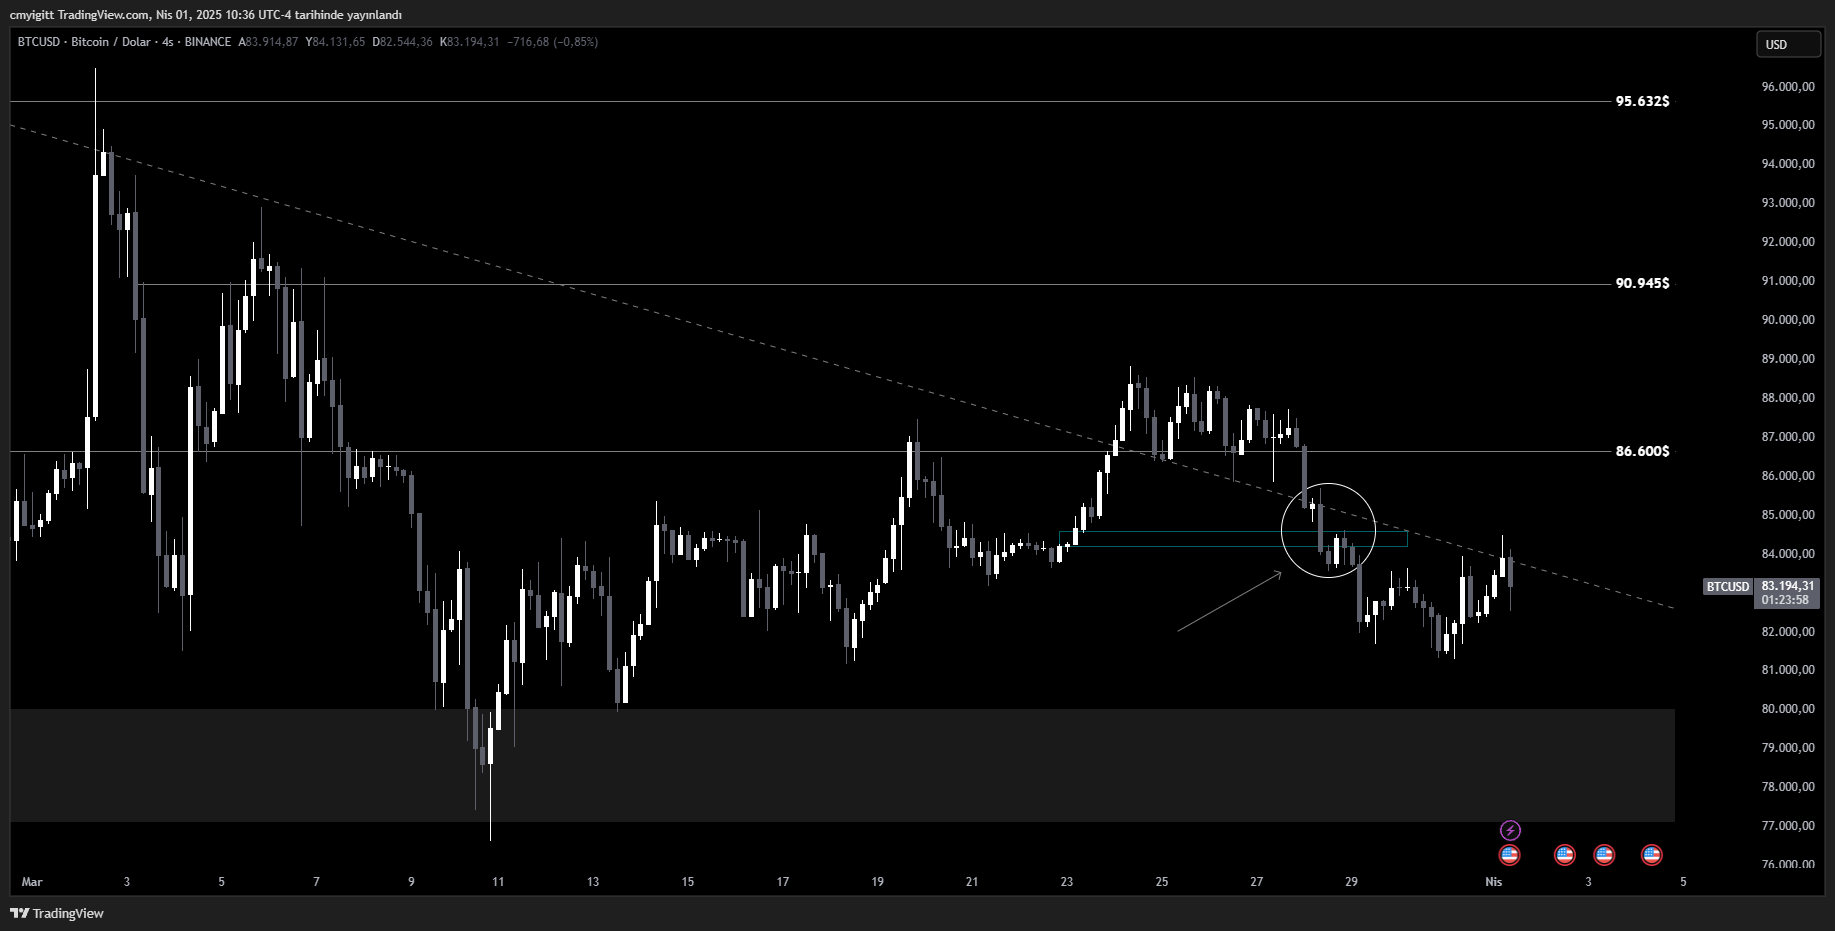
Bitcoin has sharply broken into the trend and lost the FVG (Fair Value Gap) zone, as mentioned in our previous analysis, dropping to our target level of $83.000, even testing $81.000 momentarily.
From this level, buying pressure emerged, pushing Bitcoin back up towards the trend resistance. However, strong selling pressure was observed at this level. Based on the current price action of Bitcoin, two main scenarios stand out:
Bullish Scenario:
- If Bitcoin manages to break the current trend resistance with high volume, the uptrend may continue.
- In this case, the first target for Bitcoin would be $86.000.
- A stronger move could push it towards a new all-time high.
You Might Be Interested In: Elon Musk Talks About the Name of a New Memecoin!
Bearish Scenario:
- If Bitcoin faces rejection at the trend resistance, a pullback is likely.
- In this case, the initial support level to watch would be $83.000.
- If selling pressure intensifies, Bitcoin could revisit $81.000.

Technical indicators suggest high volatility for Bitcoin, meaning that short-term price movements should be carefully monitored. Indicators like RSI, MACD, and volume analysis will be crucial in determining the direction of the next move.
You can also freely share your thoughts and comments about the topic in the comment section. Additionally, don’t forget to follow us on our Telegram, YouTube, and Twitter channels for the latest news and updates.


