According to an analyst who predicts a rise to $95,000, the recent drop in BTC price is expected to form new long-term bottom levels before a recovery.
Bitcoin is facing a tough battle for support, as the bull market has paused due to macroeconomic concerns.
The price of Bitcoin has lost over $12,000 in just two days, and now cryptocurrency investors and analysts are starting to target lower levels.
BTC Price Analysis: $90,000 is Not the “Bottom” Point
Bitcoin dropped to $96,000 on December 19, causing panic among both individual and institutional investors.
According to CoinGlass data, as of December 20, total crypto liquidations in the last 24 hours reached nearly $900 million.

Total Liquidations Chart
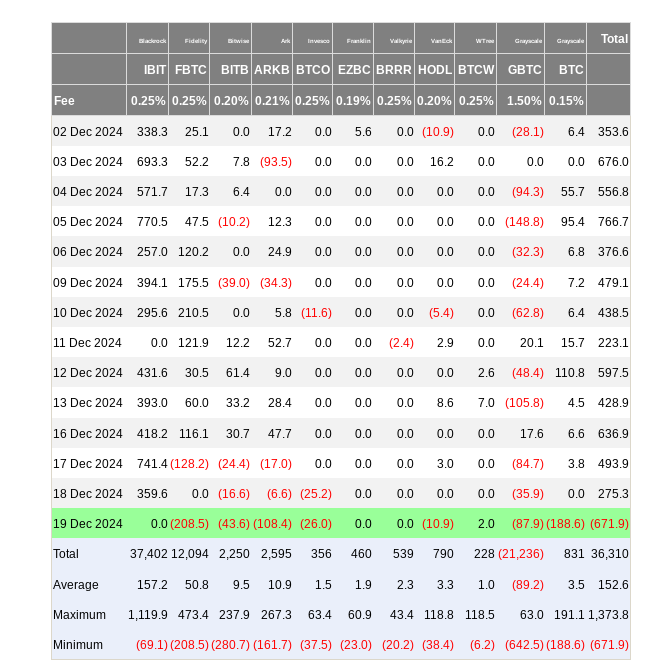
According to data from UK-based investment firm Farside Investors, US spot Bitcoin exchange-traded funds (ETFs) experienced their largest net outflow to date, totaling $679 million.

US Spot Bitcoin ETF Netflows
While this drop has, in a way, relieved some excessive speculation, long-term market participants are worried that worse may be ahead.
Among them is X commentator BitQuant, known for his long-term optimistic outlook on Bitcoin, who frequently predicted that Bitcoin would reach $95,000 before breaking its previous all-time high set in March of this year.
In his recent posts, BitQuant stated that it is likely for BTC/USD to make a deeper bottom, and the drop to $90,000 earlier this month was not the bottom.
“Sorry, but no, $90,000 was not the bottom,” he replied to another user who asked about the potential turning point for the market.
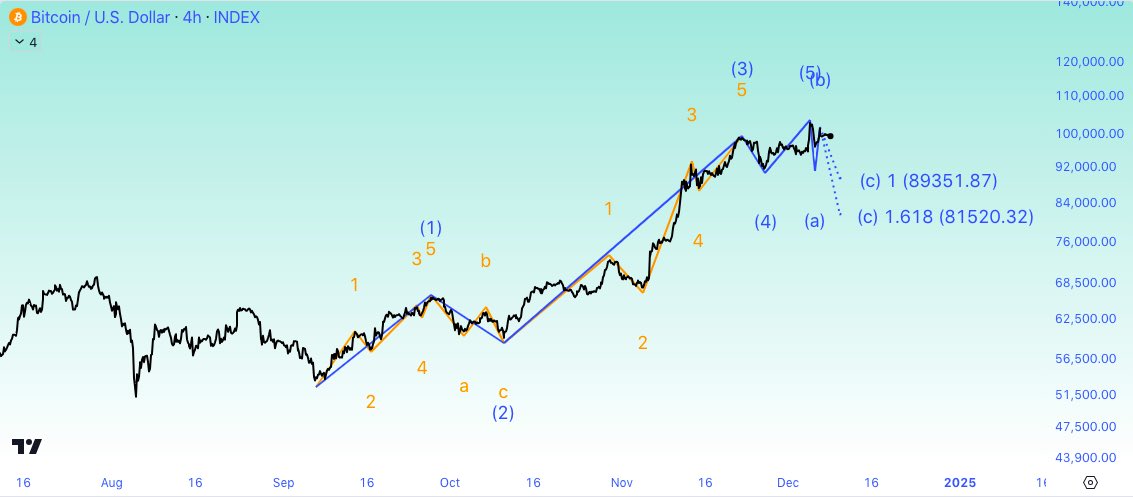
In a chart published on December 10, using Elliott Wave Theory, the price of BTC was projected to drop to the mid-$80,000s in the next downturn.
“For those not planning to buy in the next dip, I advise you to step away from the charts and enjoy life until the rocket refuels for the next moon trip,” he added in the accompanying comment to this forecast.

BTC/USD 4 Hour Chart
Lower targets are coming from the on-chain data platform Whalemap.
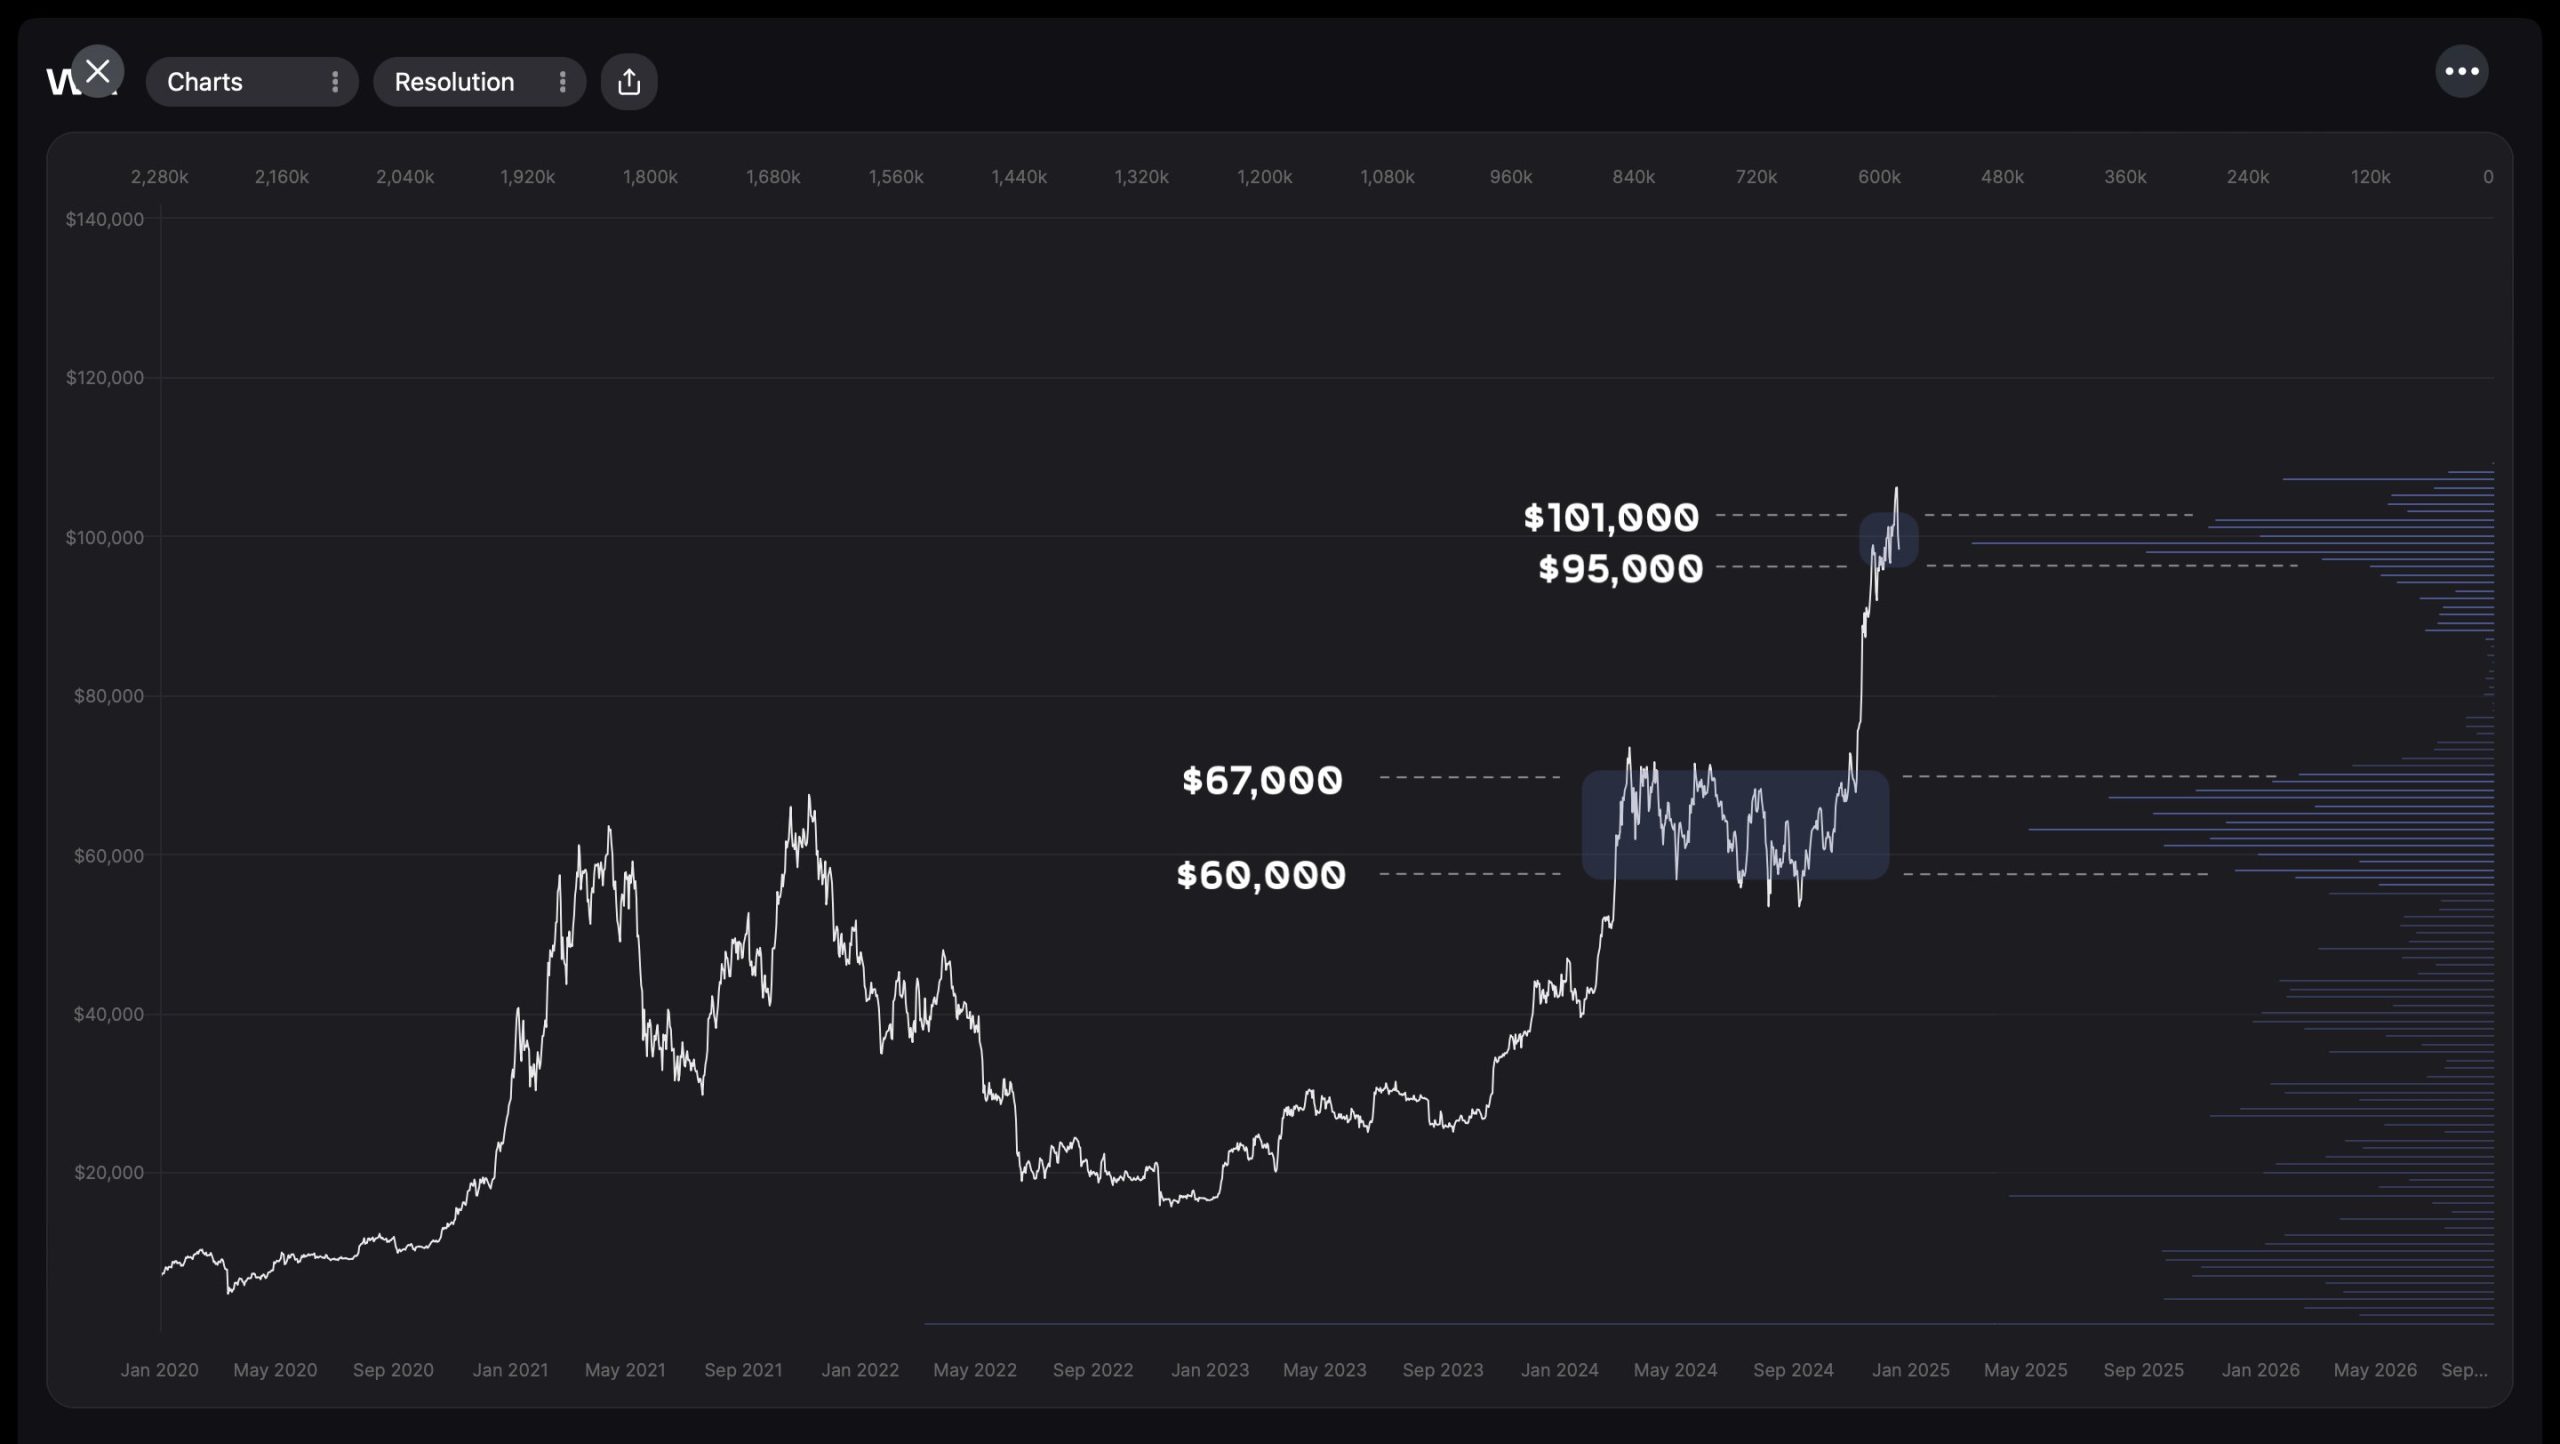
After the recent drop, the Whalemap team analyzed large accumulation areas by major investors and identified an area of interest that is about 30% below the current spot prices.
“The Onchain Volume Profile shows significant Bitcoin accumulation between $60,000 and $67,000. And a new accumulation range is forming at the current price levels,” they wrote on X.
“For long-term HODLers – the risk-reward ratio is well-defined on a macro scale – a drop below $60,000 is not expected in the near future.”

BTC/USD 4 Hour Chart
Bitcoin and Cryptocurrencies Rank Among “Extremely Vulnerable” Assets
Changes in US macro policies have put a halt to the widespread rally in risk assets, which observers are increasingly finding irrational.
The Federal Reserve triggered this reversal by lowering its rate-cut expectations for 2025, due to rising inflation indicators.
QCP Capital:
“While it is easy to link the wave of selling to the Fed’s hawkish rate cut stance, the fundamental reason for this morning’s crash is the market’s overly optimistic positioning.”
“Since the election, risk assets have experienced a one-sided, impressive rally, which has left the market extremely vulnerable to any shocks.”
You can also freely share your thoughts and comments about the topic in the comment section. Additionally, don’t forget to follow us on our Telegram, YouTube, and Twitter channels for the latest news and updates.


