


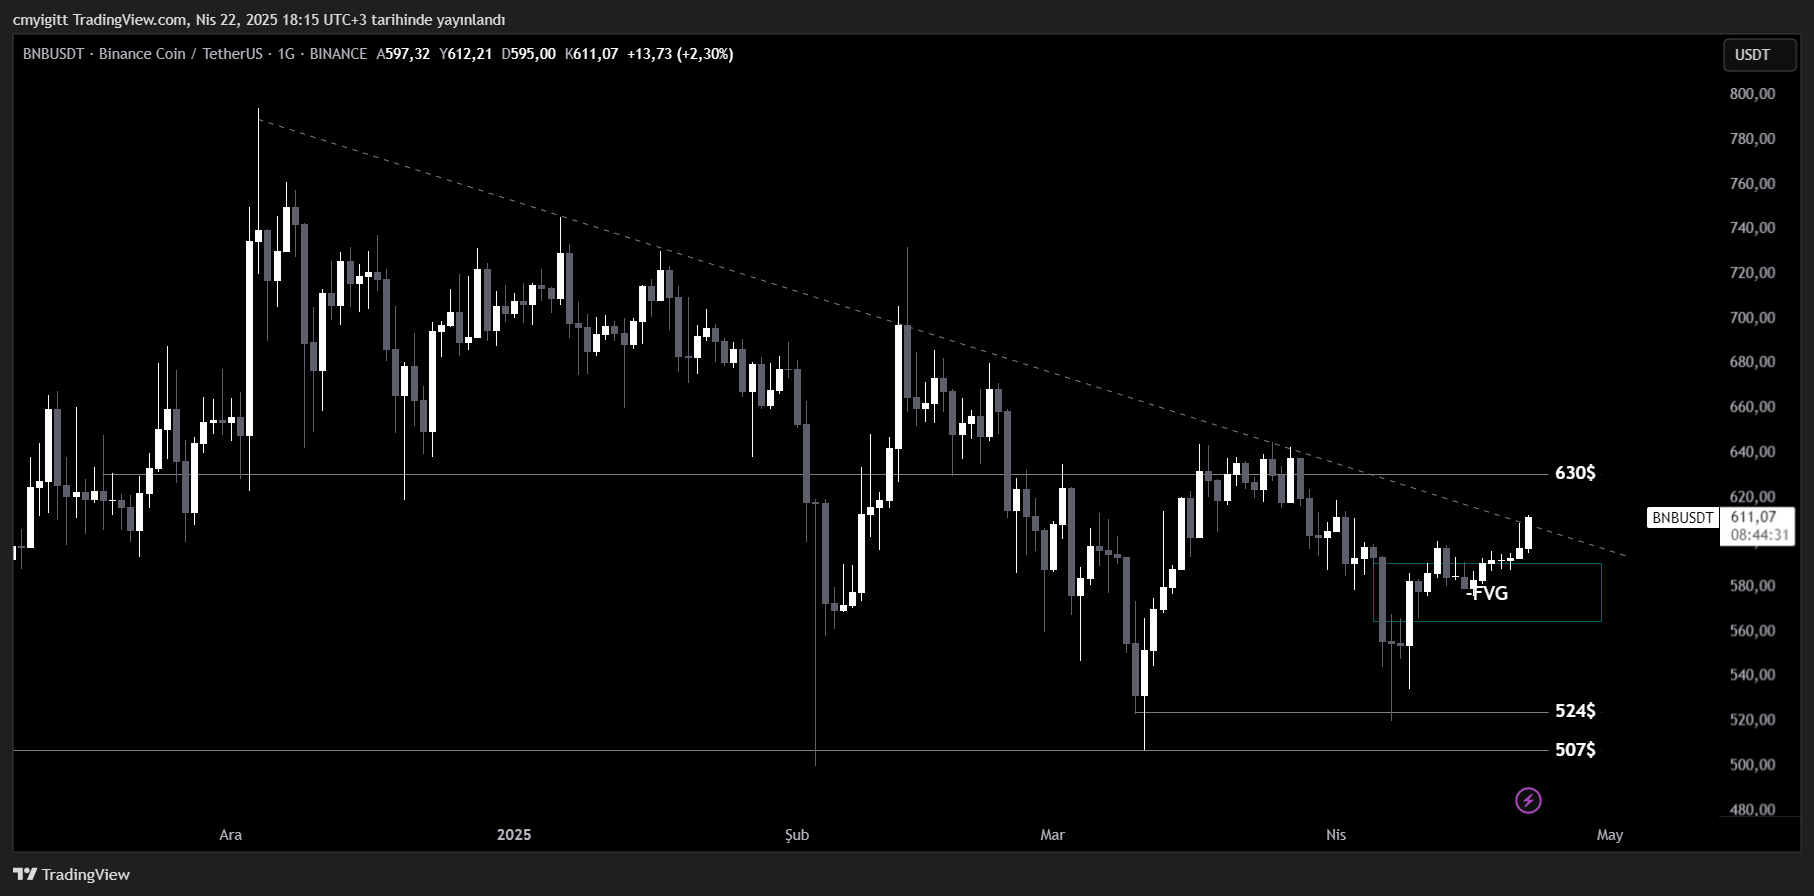
BNB has reclaimed the bearish FVG (Fair Value Gap) zone previously discussed in technical analyses and is now testing a significant descending trendline on the daily chart.
Descending Trend Under Pressure
This level is critical, as a confirmed breakout could lead to a push toward the $630 level. Historically, this zone has acted as strong resistance, and a successful move above it could open the door for further gains toward the $650–$660 range.
You Might Be Interested In: Elon Musk Talks About the Name of a New Memecoin!
$630 as a Key Resistance Level
On the other hand, a rejection from the trendline would shift attention back to the recently reclaimed FVG zone, which would then be expected to act as support. In this scenario, a consolidation phase around the support region could follow before a clearer trend direction emerges.
Traders are watching closely as price action in these zones will likely provide crucial clues on BNB’s short-term momentum and overall trend shift.
You can also freely share your thoughts and comments about the topic in the comment section. Additionally, don’t forget to follow us on our Telegram, YouTube, and Twitter channels for the latest news and updates.