


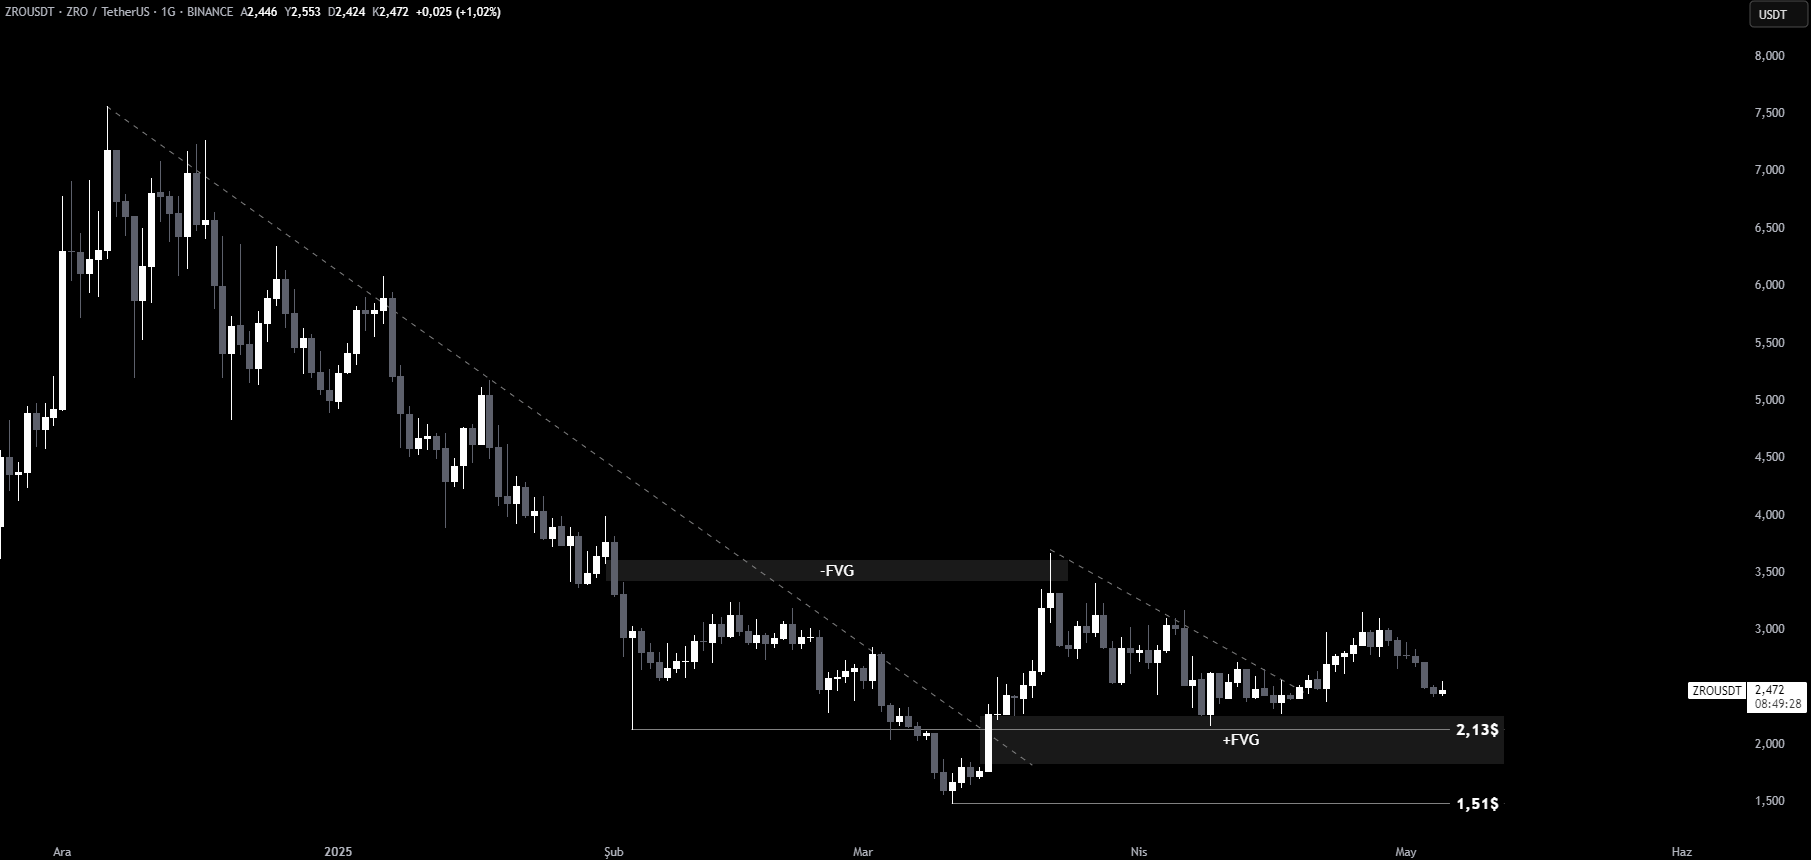
In our recent analysis, we noted that a breakout of the minor descending trend in ZRO could push the price towards 3$. This played out accurately as the token rallied to 3.15$ after the trendline break. However, selling pressure emerged near this level, causing the price to reverse and begin a new downward movement.
You Might Be Interested In: Elon Musk Talks About the Name of a New Memecoin!
Now, all eyes are on the next potential support. According to technical indicators, the 2.13$ level stands as a key support zone, having previously acted as a strong base where buyers stepped in. If the current downward momentum continues, this level will be a crucial test for ZRO bulls.
A Break Below 2.13$ Could Target FVG Region
Should the 2.13$ support fail to hold, the next zone to watch lies at the lower bounds of the bullish FVG (Fair Value Gap) region. This area represents zones of previous heavy buying and could offer a reaction or temporary relief.
ZRO’s price trajectory remains closely tied to broader market trends. Movements in Bitcoin (BTC) and Ethereum (ETH) will likely influence its direction. For investors, this is a time to closely manage risk, monitor key levels, and adjust strategies based on confirmed price actions.
You can also freely share your thoughts and comments about the topic in the comment section. Additionally, don’t forget to follow us on our Telegram, YouTube, and Twitter channels for the latest news and updates.