

While the broader crypto market remains sideways, some altcoins are starting to show technical breakouts. Most recently, ONDO broke its descending trendline on the daily chart, catching the attention of traders. Could this breakout signal the start of a sustained uptrend?
Downtrend Broken, Minor Uptrend Forming
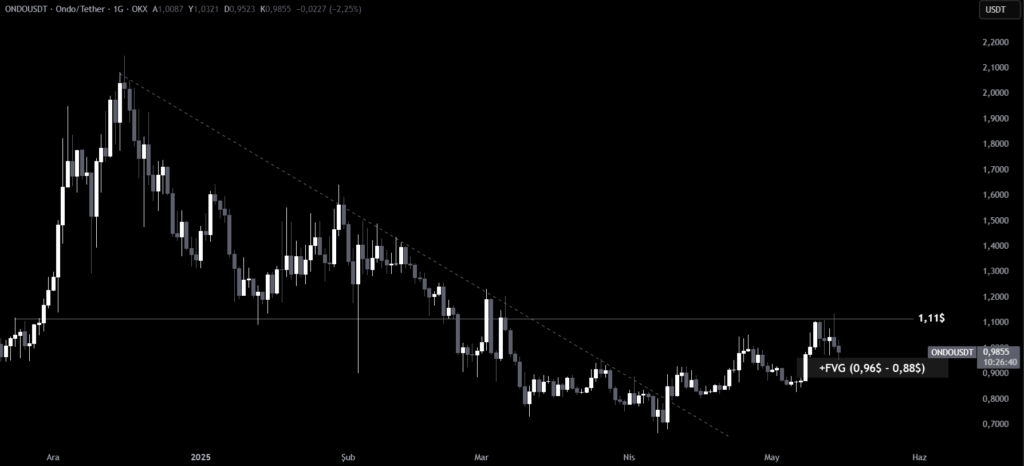
After a prolonged period under pressure, ONDO has taken a technically significant step. The descending trendline on the daily chart has been broken to the upside, and a minor ascending channel has begun to form. This breakout, especially with volume support, has piqued investor interest.
You Might Be Interested In: Elon Musk Talks About the Name of a New Memecoin!
If FVG Zone Holds, Target Could Be 1.11$
According to technical analysis, if ONDO can maintain support within the bullish FVG (Fair Value Gap) zone between 0.96$ – 0.88$, the price could potentially move toward the next resistance level at 1.11$. This range is also a key zone where short-term buying interest tends to increase.
However, caution is still warranted. If the FVG support zone is broken to the downside, the next likely stop for ONDO would be around 0.80$. This would suggest a renewed correction phase. While technical indicators currently show cautious optimism, price movements remain sensitive to support and resistance zones.
You can also freely share your thoughts and comments about the topic in the comment section. Additionally, don’t forget to follow us on our Telegram, YouTube, and Twitter channels for the latest news and updates.