


In the midst of ongoing market volatility, AVAX has shown signs of weakness after losing its short-term uptrend. The price action on the 4-hour chart now points to a crucial support test that may determine the next directional move.
Trend Break Sends AVAX Toward Key Support Level
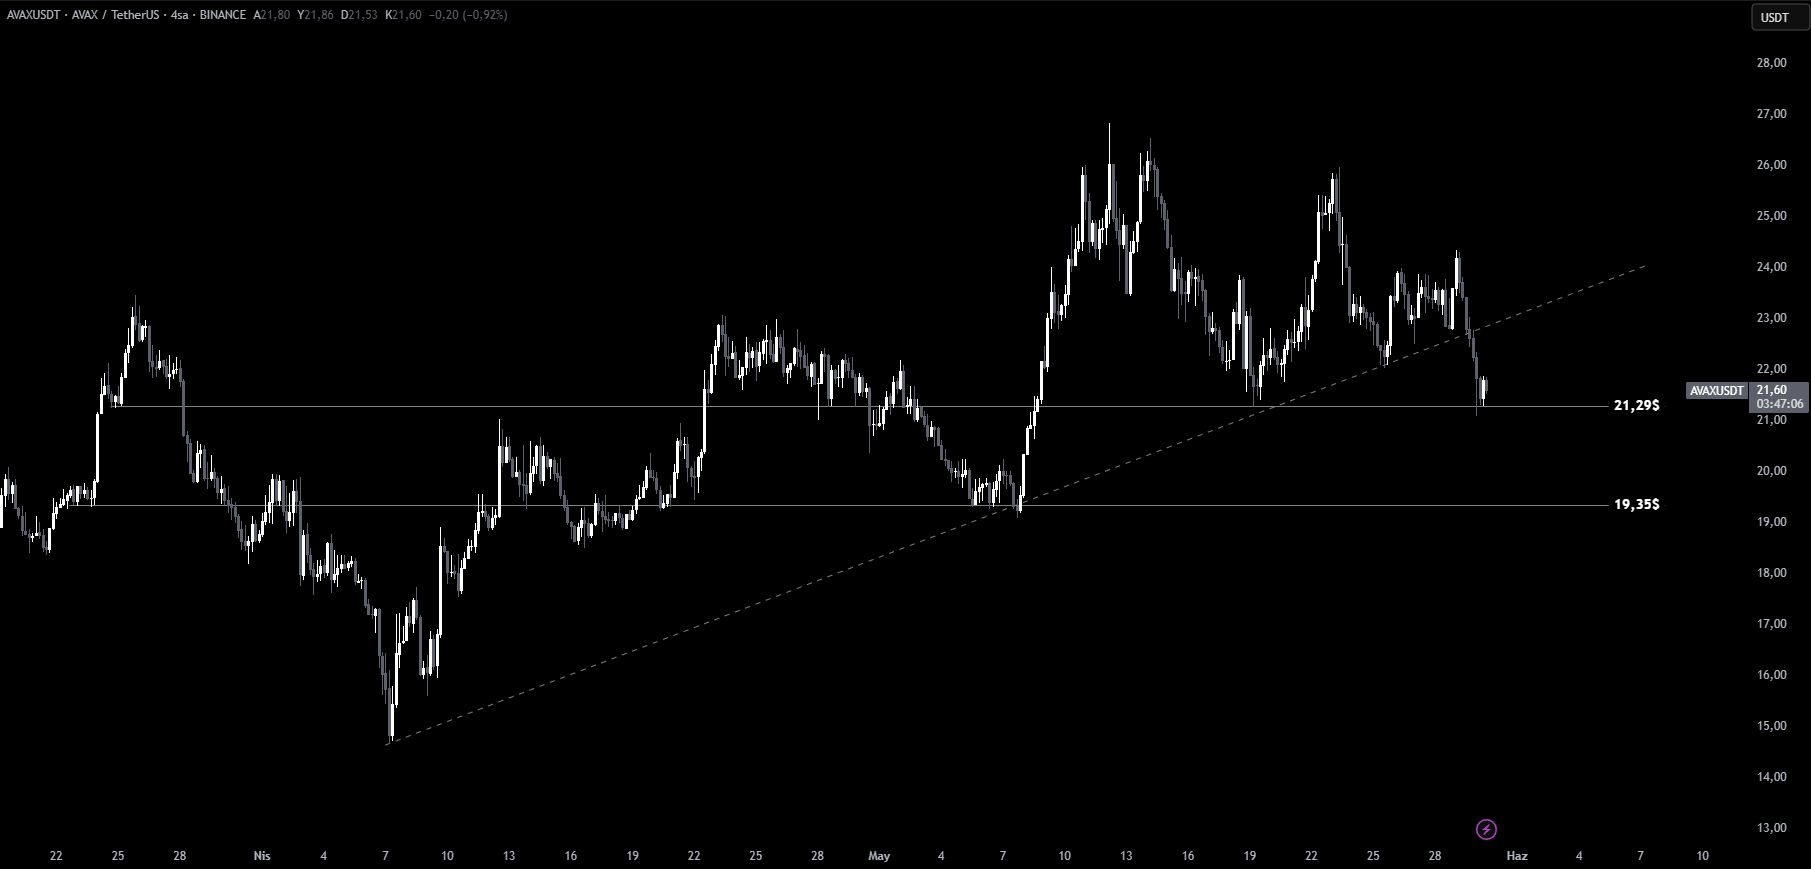
After breaking below the rising trendline on the 4-hour timeframe, AVAX slipped to test the 21.29$ support level. Although some buying activity emerged at this zone, the price hasn’t yet re-entered the lost trend channel.
You Might Be Interested In: Elon Musk Talks About the Name of a New Memecoin!
If 21.29$ is broken with a 4-hour candle close, the next major support level to watch lies at 19.35$. Such a move could reinforce the bearish momentum and lead to further downside in the short term.
Retesting the Broken Trendline as Resistance
On the flip side, if AVAX continues to hold above 21.29$ and bounces from this level, the previously lost trendline will now act as a resistance. Reclaiming that level would be a signal of strength and could pave the way for a short-term recovery.
Traders should monitor volume levels and 4-hour candle closures around this zone to better interpret whether the market favors continuation or reversal.
You can also freely share your thoughts and comments about the topic in the comment section. Additionally, don’t forget to follow us on our Telegram, YouTube, and Twitter channels for the latest news and updates.