


As markets display mixed signals, traders are turning their attention back to Ethereum. Amid uncertain price swings, technical indicators on the daily chart suggest a decisive moment may be near. It’s no longer just about the direction—timing is everything.
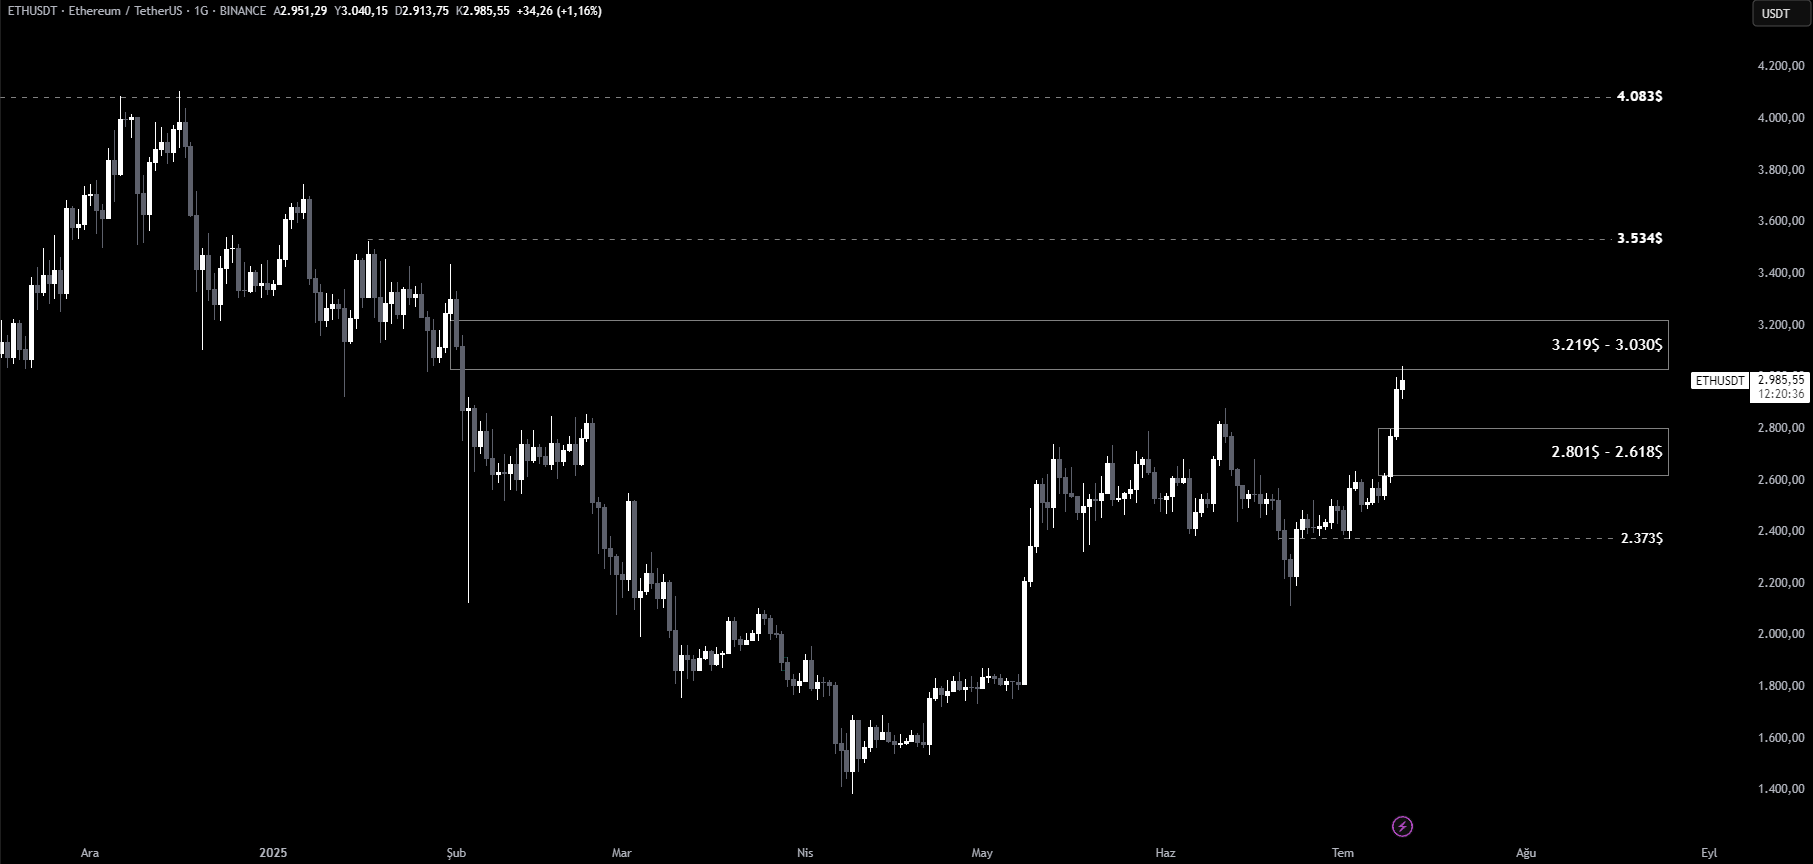
Currently, Ethereum remains within a downward Fair Value Gap (FVG) zone on the daily chart, struggling to break out decisively. This zone has now become a critical area of resistance and could shape the asset’s next move.
Resistance Zone Holds the Key
Price is consolidating between the 3,219 – 3,030 dollar range, marking the refined FVG resistance. If this level breaks upward, the next target sits at the 3,534 dollar liquidity area. Should selling pressure remain weak at that point, the rally could extend further toward the next major target at 4,083 dollars.
You Might Be Interested In: Sonic SVM Research: Can New Stablecoins Shake Up the Old Order?
Traders are advised to take caution. As price approaches key levels, gradual profit-taking and risk reduction strategies become increasingly important to avoid sudden volatility.
Support Must Hold
In the event of a downturn, the immediate support lies between 2,801 and 2,618 dollars. Losing this range could trigger a deeper correction, potentially dragging price down to the 2,400 dollar zone. Maintaining this support area is crucial to preserve bullish potential.
You can also freely share your thoughts and comments about the topic in the comment section. Additionally, don’t forget to follow us on our Telegram, YouTube, and Twitter channels for the latest news and updates.