

While much of the crypto market remains under pressure, certain altcoins are showing signs of strength. Among them, Sei has reached a technically significant zone that could shape its short-term trajectory.
Key Resistance In Focus
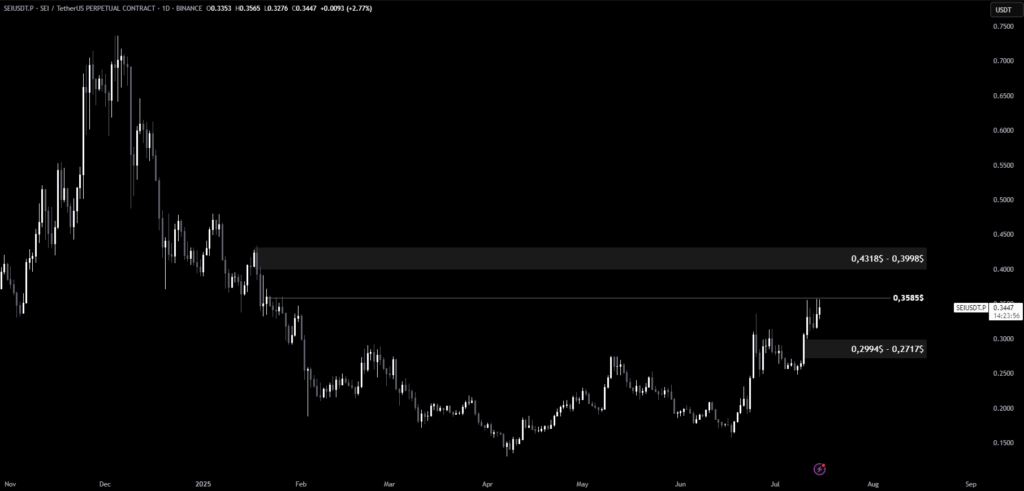
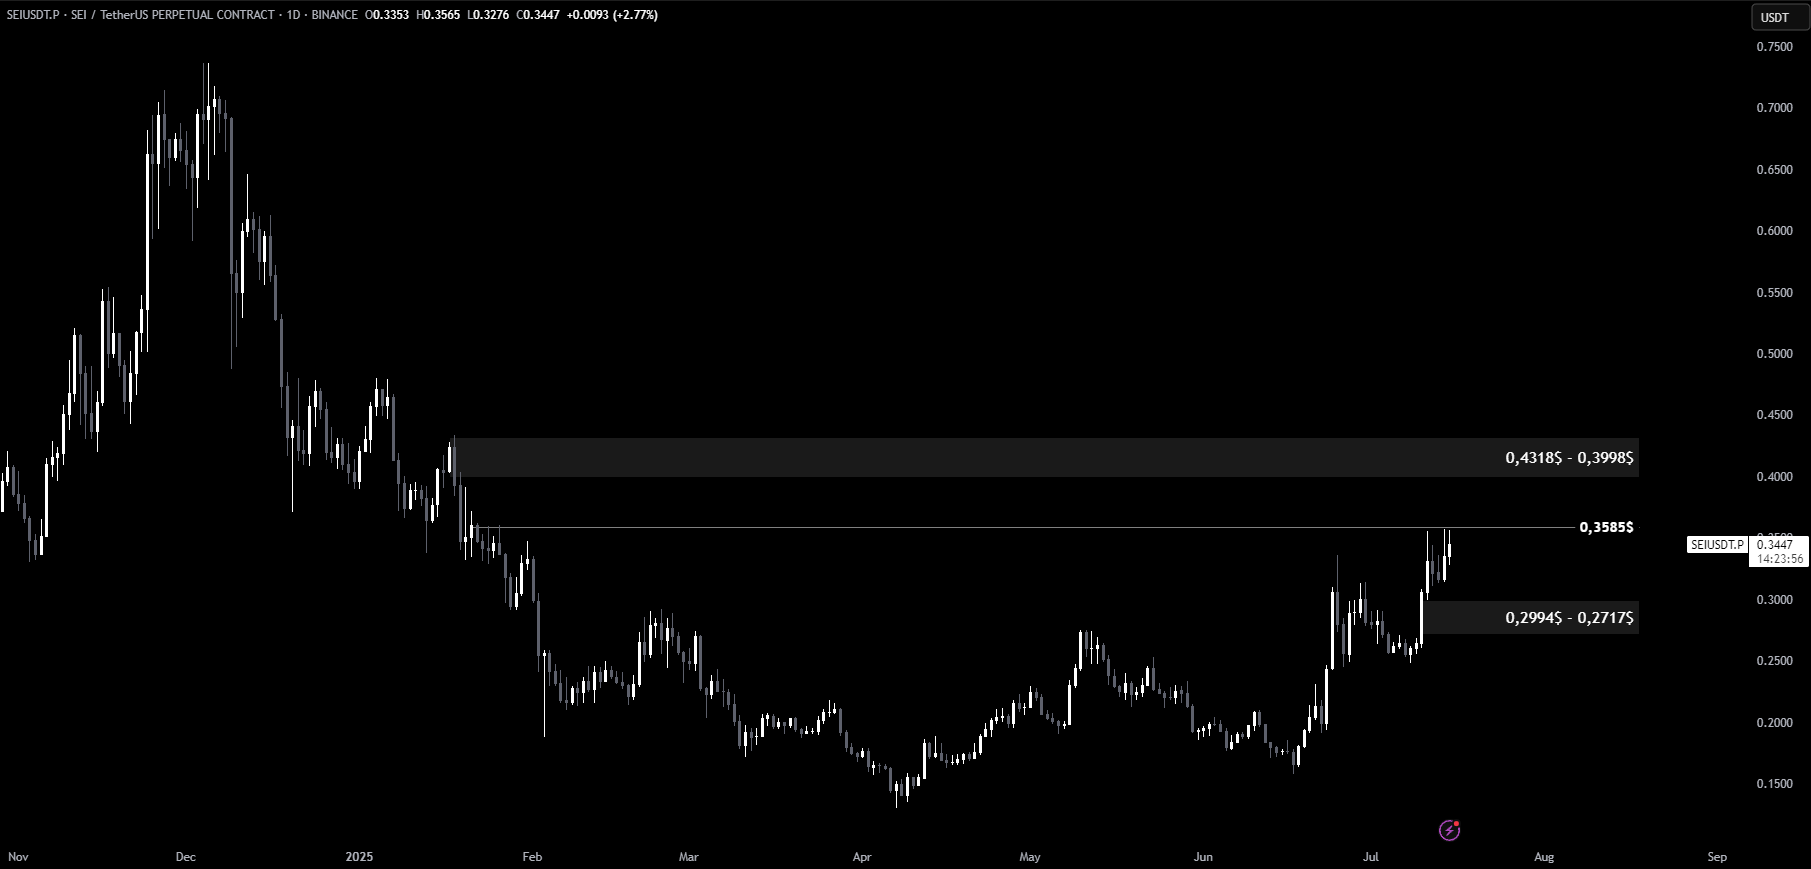
On the daily chart, Sei has climbed toward the critical $0.3585 resistance level. This zone has previously acted as a strong rejection point, making its current test especially noteworthy.
You Might Be Interested In: Sonic SVM Research: Can New Stablecoins Shake Up the Old Order?
If Sei can break and hold above this level, the next target could be in the $0.4318 – $0.3998 resistance range. This upper zone may attract increased bullish momentum and strengthen the ongoing uptrend.
Support Levels To Watch On Pullbacks
Should the market face renewed selling pressure, a pullback toward the support zone between $0.2994 – $0.2717 may unfold. This area has previously provided a reliable floor during past corrections and may do so again if weakness emerges.
Traders are advised to closely monitor how Sei behaves around these critical levels, as potential breakouts or rejections could define the next major move.
You can also freely share your thoughts and comments about the topic in the comment section. Additionally, don’t forget to follow us on our Telegram, YouTube, and Twitter channels for the latest news and updates.