


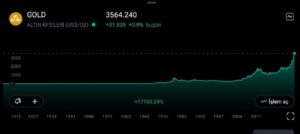
After reaching an all-time high of $3,500 on April 22, gold went through a four-month consolidation and a $380 correction wave before breaking out of its triangle pattern and climbing to $3,565. So, what triggered this rally?
Factors Driving the Rally
- Safe-haven demand: Global central banks made strong gold purchases amid political turmoil.
- SPDR Gold Trust asset increase: Holdings rose 1.32%, reaching their highest level since August 2022.
- Political pressure on the Fed: Concerns over the Fed’s independence reduced investor confidence in the Dollar and U.S. Treasuries, boosting demand for gold.
- Rate cut expectations: Markets are pricing in a 92% chance of a 25 bps rate cut by the Fed in mid-September, supporting gold demand.
Technical Analysis: Where Is Gold Headed?
Gold has reached the triangle breakout target of $3,545. A pullback toward support zones is likely before any new upward extension.
- Short-term resistances:
- If bulls succeed above the $3,542–$3,547 range, the next resistance is $3,555, followed by $3,573–$3,578.
- Short-term supports:
- Breaks below $3,530–$3,525 may trigger declines to $3,515–$3,508, then $3,498–$3,488.
- Deeper pullback levels:
- If selling intensifies, the 4-hour 50 EMA levels at $3,440 and $3,415 will be key levels to watch.
Currently, gold is consolidating sideways in a narrow range, trading below $3,542 and above $3,530, near the 4-hour 5 EMA.
Conclusion
Gold has broken out of its triangle formation thanks to strong safe-haven demand and Fed-related uncertainties. Technically, the short-term support and resistance levels stand out as key points for investors to monitor.
You can also freely share your thoughts and comments about the topic in the comment section. Additionally, don’t forget to follow us on our Telegram, YouTube, and Twitter channels for the latest news and updates.