


Bitcoin has shown a price structure that has exhausted investors in recent months. Despite this visible weakness, economist Timothy Peterson’s latest calculation points to a different statistical possibility beneath the surface. According to Peterson, Bitcoin has an 88% probability of trading above its current level by December 2026. The number sounds bold. But the underlying logic is unexpectedly simple: half of the past 24 months closed in positive territory.
This is not a conventional technical indicator. It does not rely on moving averages, RSI, or momentum oscillators. Instead, Peterson focuses on the internal rhythm of the market. By measuring how many months close positive within rolling 24-month windows, he attempts to identify structural balance. His interpretation is straightforward. When positive and negative months distribute evenly, the market often sits near transition zones rather than collapse phases.
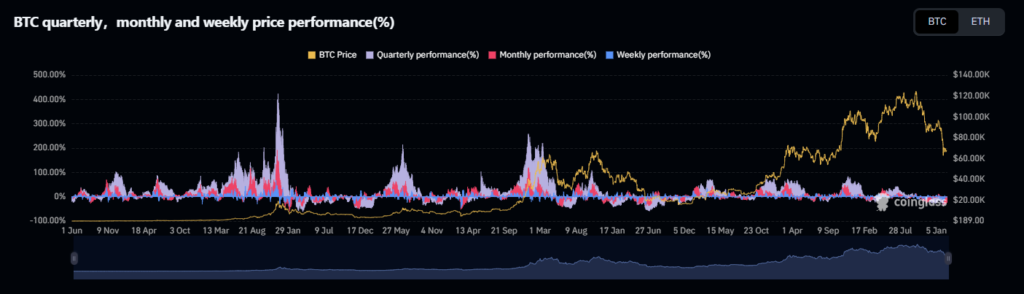
Bitcoin’s 24-month data shows balance
Over the last two years, Bitcoin has produced an almost symmetrical performance structure. Twelve of the past 24 months ended in gains. The other twelve closed lower. In 2025 alone, Bitcoin recorded positive closes in January, April, May, June, July, and September. The remaining months leaned negative.
This kind of distribution matters. A structurally weak asset typically produces extended sequences of negative closes. Bitcoin has not shown that pattern. Instead, the data reflects equilibrium. Pressure exists, but so does resilience.
Peterson’s conclusion follows directly from this balance. Based on historical probability patterns, he estimates an 88% likelihood that Bitcoin will trade above current levels within the next 10 months.
This is not certainty. It is probability. Still, probability defines markets more often than prediction.
Bitcoin price remains below yearly start
Despite the statistical optimism, BTC continues to trade roughly 25% below its level at the beginning of the year. That decline has weighed heavily on sentiment. Confidence eroded gradually, not all at once. And gradual declines tend to leave deeper psychological marks.
The Crypto Fear & Greed Index recently dropped to 9, placing sentiment firmly in the “Extreme Fear” zone. Historically, such readings appear near moments of structural stress. Sometimes they precede deeper declines. Other times, they appear just before stabilization begins.
Behavioral data from Santiment adds another subtle signal. Social media discussion and price prediction activity around Bitcoin have declined noticeably. At first glance, this looks like fading interest. In practice, it often reflects emotional exhaustion. Speculative noise fades. The market becomes quieter. And quiet markets often rebuild foundation.
Analysts divided on Bitcoin price outlook
Market participants remain split. Some analysts expect recovery in the near term. Among them is trader Michael van de Poppe, who recently suggested Bitcoin could see short-term strength following consecutive weak months.
Others remain cautious. Veteran trader Peter Brandt believes the true bottom may not arrive until October 2026. His view reflects the possibility that Bitcoin has not yet completed a full capitulation cycle.
These conflicting interpretations reflect a market still searching for direction. Neither bulls nor bears have established decisive control.
Historical data highlights key Bitcoin months
Seasonality data from CoinGlass reinforces the importance of late-year performance. Since 2013, November has delivered Bitcoin’s strongest average returns, exceeding 41%.
Prediction market data from Polymarket shows similar expectations. Traders currently assign November 2026 an 18% probability of being Bitcoin’s best-performing month, with December close behind at 17%.
This timing is not random. Strong performance periods often follow extended sentiment compression. Weak sentiment environments tend to reset positioning.
Bitcoin structure shows statistical stability
Bitcoin does not currently display a confirmed bullish trend. But it does not show structural collapse either. The equal distribution of positive and negative monthly closes suggests internal stability remains intact.
Markets rarely move in straight lines. They compress. They hesitate. They drift. Direction emerges later.
Peterson’s 88% probability estimate does not promise a rally. It simply reveals that beneath current fear and uncertainty, the statistical structure still allows for recovery.
Also, you can freely share your thoughts and comments about the topic in the comment section. Additionally, please follow us on our Telegram, YouTube and Twitter channels for the latest news and updates.