


The crypto market is moving cautiously but not without key technical signals. Traders are closely watching Bitcoin‘s price action on short-term charts, and recent movements are giving subtle yet important clues.
Resistance Holding Firm
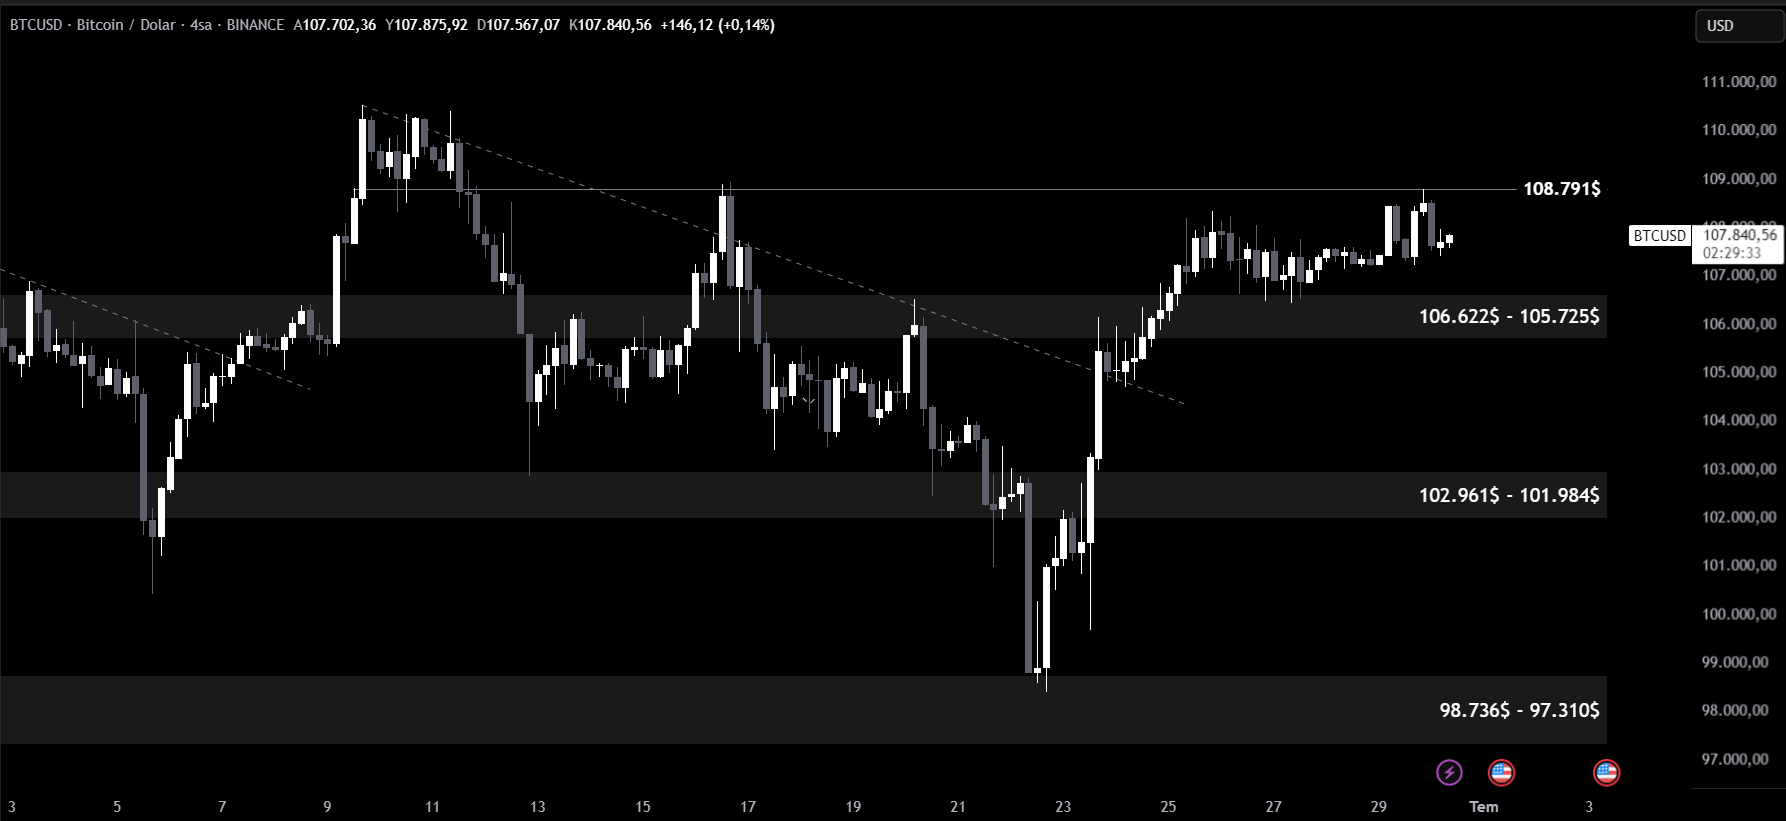
In the 4-hour timeframe, the previously mentioned 108,791 USD resistance level was tested. However, there was no convincing breakout, and Bitcoin faced rejection. This indicates a lack of strong bullish momentum for now.
You Might Be Interested In: Elon Musk Talks About the Name of a New Memecoin!
If Bitcoin manages to close above 108,791 USD, the next potential target range could be 111,000 – 112,000 USD. Until then, the market may remain range-bound.
Support Levels To Watch
On the downside, the nearest support zone lies between 106,622 and 105,725 USD. A drop below this range could lead to further corrective moves, while holding above might invite fresh buying interest.
A decisive move, preferably backed by volume, is needed to confirm a trend direction. Without that, price action may continue to fluctuate within a narrow range, frustrating both bulls and bears.
You can also freely share your thoughts and comments about the topic in the comment section. Additionally, don’t forget to follow us on our Telegram, YouTube, and Twitter channels for the latest news and updates.