


Bitcoin Challenged $110,000, But Pulled Back
Bitcoin surged to $109,400 on Sunday. However, with declining market volume, it pulled back by 1.5%. The price dropped to $108,000, remaining below the critical resistance level of $110,000. The RSI indicator signaled overbought market conditions, creating pressure at the $110,000 level.
Although the price action technically maintains bullish consolidation, it showed that short-term upside potential is limited. BTC hit a record $106,100 on May 20 and has remained structurally strong by closing above this level. Coingecko data confirmed five consecutive daily closes above it.
Decline in Whale Transactions Puts Pressure on Bitcoin
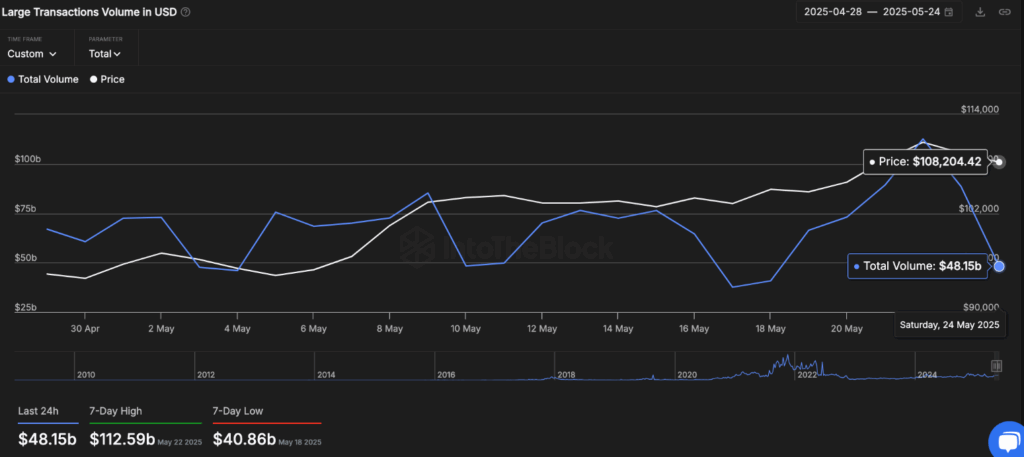
Decreased liquidity and trading volume over the weekend slowed Bitcoin’s upward momentum. The 24-hour trading volume fell to $26 billion—down 70% from Thursday’s $75 billion peak. Whale trading volume dropped by 57.2% from $112.6 billion to $48.15 billion within two days.
This decline coincided with Bitcoin’s failure to break the $110,000 resistance, indicating selling pressure from whales. As whale volume fell below the 30-day moving average, BTC risks retesting the $106,000–$107,000 support levels.
Technical Analysis: Momentum Weakens
Bitcoin’s short-term outlook remains cautiously constructive. The price is holding above $106,000, now acting as strong support following last week’s rejection around $112,000. However, technical indicators suggest weakening momentum.
The Relative Strength Index (RSI) fell from 74 to 63.39, showing the market is no longer overheated but buying pressure has eased. As a result, investors are expecting a sideways consolidation rather than a breakout. Also, the MACD histogram is flattening, with the MACD line just above the signal line. This suggests bullish momentum is fading, though a bearish reversal hasn’t occurred yet. A renewed bullish move could emerge, but if weakness continues, it may shift into a bearish divergence.
Another key metric is BTC holding above its 5-day SMA ($107,856) and 13-day SMA ($106,216). Maintaining these levels highlights the critical importance of the $106,000 support zone. Otherwise, a drop to the $104,000–$105,000 range becomes more likely. Volume remains at 14.03K BTC, and investors are waiting for stronger buy signals for Bitcoin to surpass $110,000.
***NOT INVESTMENT ADVICE***
You can also freely share your thoughts and comments about the topic in the comment section. Additionally, don’t forget to follow us on our Telegram, YouTube, and Twitter channels for the latest news and updates.