

As crypto market volatility picks up once again, price movements in certain altcoins are beginning to draw serious attention. One such project, Celestia, has seen notable declines recently, putting it back under investors’ radar. The big question: is this just a correction or the start of a deeper downtrend?
Key Support Zone Under Pressure
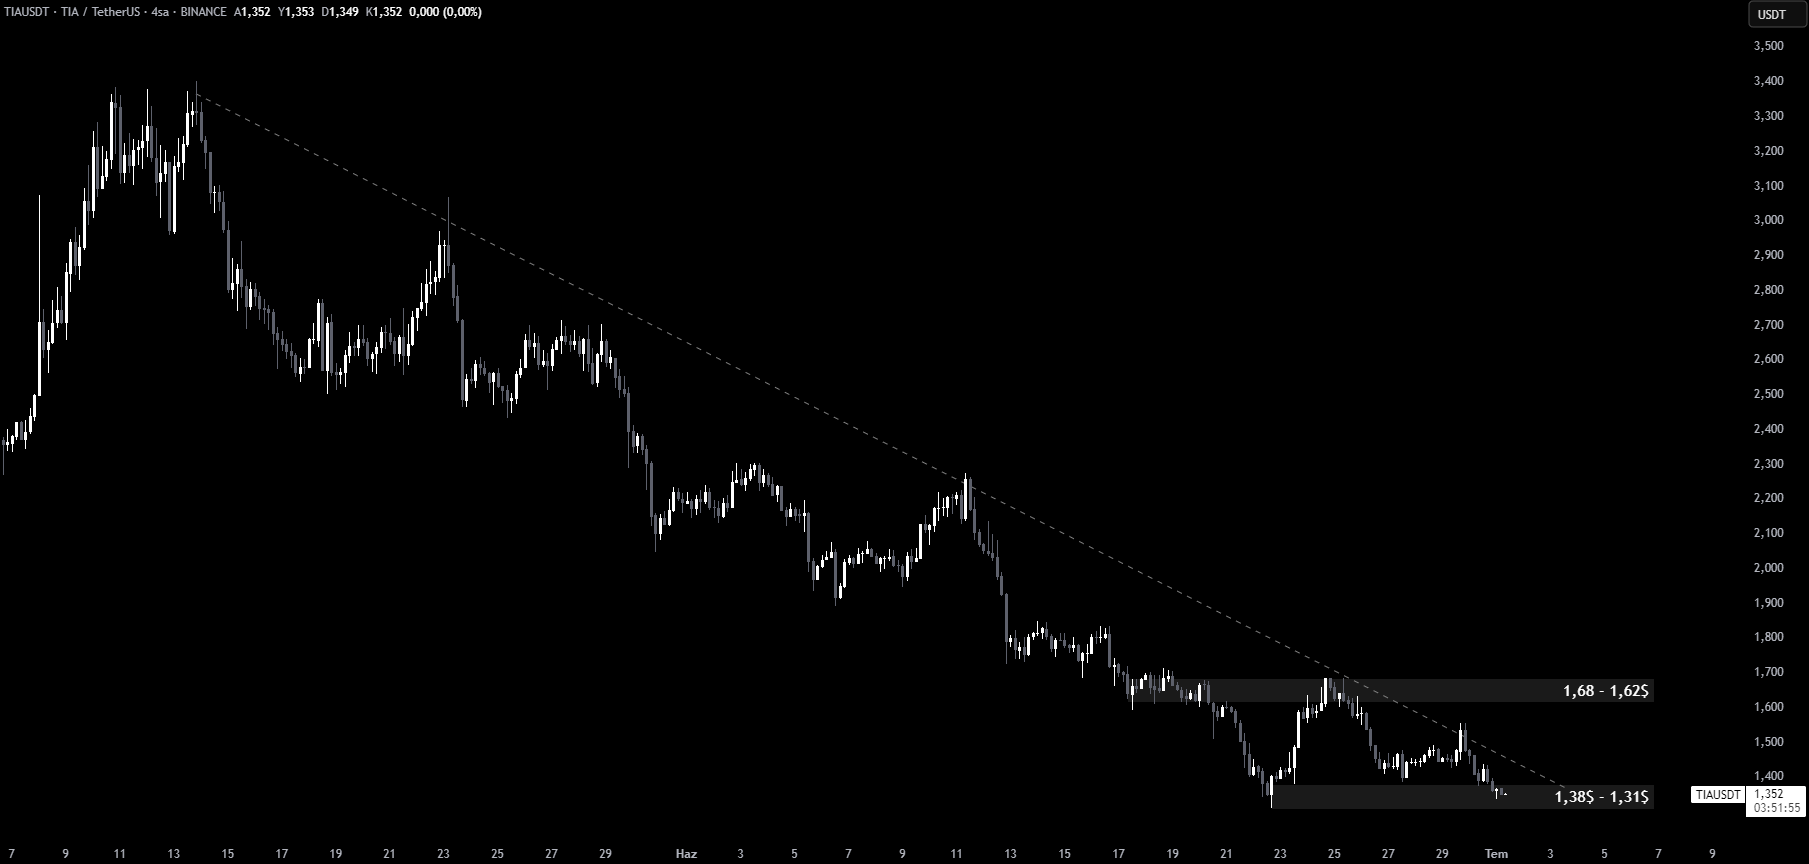
Recent data shows that the price of TIA has dropped into the $1.38 to $1.31 support range. This area is highly significant from a technical perspective. A breakdown below this level could lead to new lows for TIA, especially if selling pressure intensifies and trading volumes remain weak. Market watchers would do well to keep a close eye on this level in the days ahead.
You Might Be Interested In: Elon Musk Talks About the Name of a New Memecoin!
Upside Potential If Resistance Breaks
Not all hope is lost, however. Should the descending trendline break to the upside, TIA could target its next resistance between $1.68 and $1.62. A successful move beyond this range may re-energize bullish sentiment and push the price higher. For short-term traders, this breakout could offer a fresh opportunity.
What happens next for Celestia within this narrowing range will likely determine the near-term trajectory. While indicators remain mixed, this zone could offer critical trading opportunities for both bulls and bears.
You can also freely share your thoughts and comments about the topic in the comment section. Additionally, don’t forget to follow us on our Telegram, YouTube, and Twitter channels for the latest news and updates.