


As the crypto markets consolidate, Bitcoin (BTC) has shown a significant technical formation that may signal a potential bullish breakout. A double bottom pattern has been spotted on the BTC chart, indicating that momentum could be shifting in favor of buyers.
You Might Be Interested In: Elon Musk Talks About the Name of a New Memecoin!
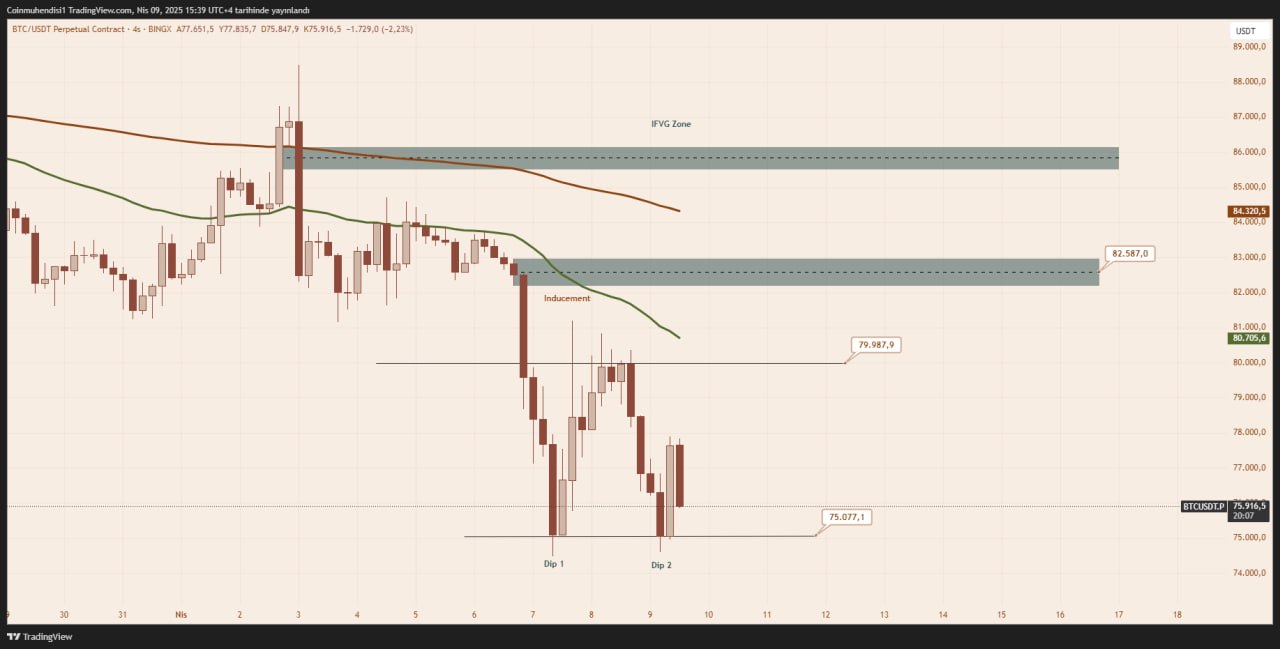
According to technical analysis, the neckline of this formation lies around $80,000. If BTC manages to break above this resistance level with volume, the technical target of the formation points to $86,000. This could mark a renewed rally and restore confidence among bullish investors.
$75,000: The Crucial Support to Watch!
However, not everything is bullish just yet. The $75,000 level currently acts as a strong support and forms the base of the pattern. If this level fails to hold, the double bottom setup would be invalidated, possibly leading to further downside pressure. In such a scenario, Bitcoin might revisit the $70,000 zone in the short term.
Analysts caution traders to remain alert, as Bitcoin’s price is at a technical crossroads. With both upward and downward possibilities on the table, effective risk management is key for navigating the current market landscape.
You can also freely share your thoughts and comments about the topic in the comment section. Additionally, don’t forget to follow us on our Telegram, YouTube, and Twitter channels for the latest news and updates.