


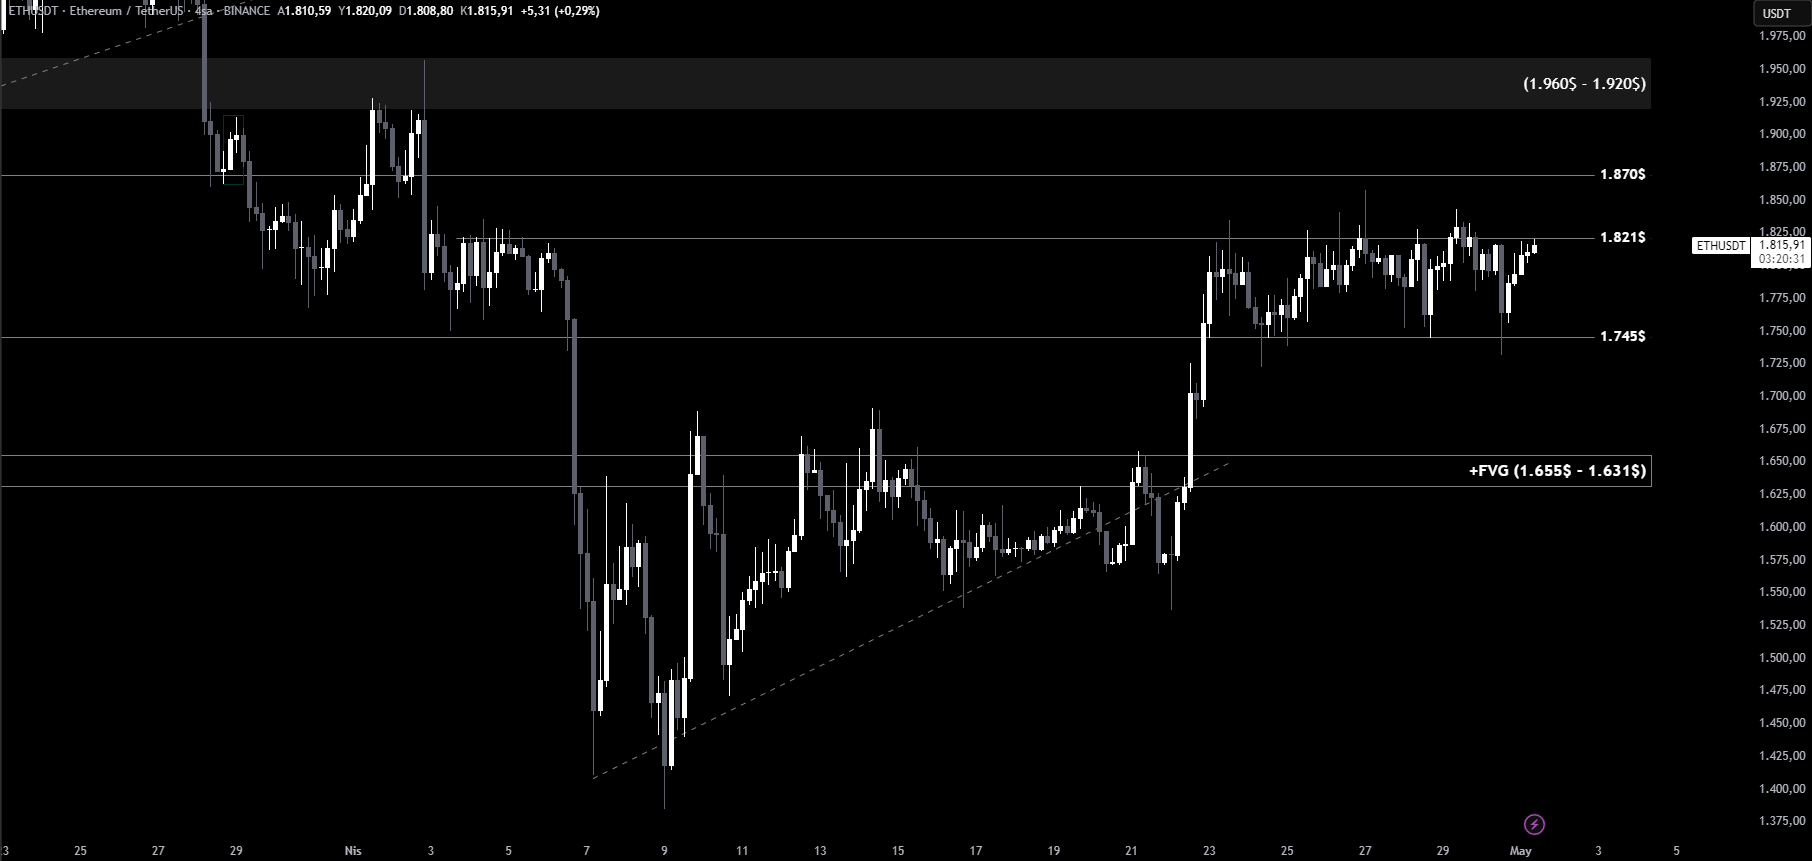
Ethereum (ETH) has been trading sideways for a while and is currently hovering just below the $1,821 resistance zone. This price level has become a major point of interest for traders, especially as volatility has decreased and ETH’s range has tightened — often a precursor to a significant move.
You Might Be Interested In: Elon Musk Talks About the Name of a New Memecoin!
If $1,821 is breached with strong volume, the next immediate target will be $1,870. A breakout to this level could indicate the beginning of a bullish continuation, providing a setup for higher short-term highs if momentum builds.
Watch These Support Levels
On the flip side, a rejection from the $1,821 resistance would put $1,745 in focus as the first nearby support. Should ETH lose that level as well, downside pressure could push the price further down toward $1,655, another notable support area. Weak volume and market uncertainty could contribute to such a retracement.
Traders are advised to closely watch price action and trading volume at these key levels to determine Ethereum’s next move.
You can also freely share your thoughts and comments about the topic in the comment section. Additionally, don’t forget to follow us on our Telegram, YouTube, and Twitter channels for the latest news and updates.