


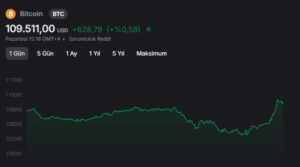
After surpassing $124,000 in mid-August to set a new record, Bitcoin (BTC) entered a downward trend. At this point, BTC fell below $110,000, and analysts indicate that the current $107,000–$109,000 range is critical for its next moves.
After reaching a new all-time high, BTC entered a downtrend, and investors are leaving hopes for a rebound to the coming days as September approaches—the month when the Fed is expected to make its first rate cut of 2025. But does Bitcoin really “like” September? How has it performed in previous years?
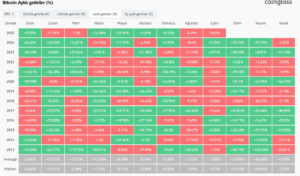
Bitcoin’s Performance in Previous Septembers
Historical data shows a certain pattern in Bitcoin’s monthly performance:
- Months with a downward tendency: January, March, August, and September
- Months with an upward tendency: February, July, October, and November
Over the past 12 years, Bitcoin has closed September with gains only 4 times, while it ended with losses 8 times. Even in the years it closed green, the gains were modest—typically around 3.9%, 6%, and 7.2%. Therefore, analysts consider September historically as the weakest month for Bitcoin.
Expectations for This September
While historical trends paint a negative picture for September, there are some notable differences this year:
- The Fed, which has kept interest rates steady since early 2025, is expected to cut rates in September.
- This potential rate cut could trigger an upward trend in BTC and the broader crypto market.
- Analyst ZYN points out a bullish divergence in weekly RSI data. Despite the recent price pullback, the decline in RSI has been limited, indicating that active buyers are still present. ZYN suggests that if current levels hold, a new all-time high could be possible within the next 4–6 weeks.
Historical Perspective: September and Beyond
Although September is often negative for Bitcoin, October and the last quarter of the year generally show strong performance.
- Historically, BTC has closed October with an average gain of around 3–8%, which is why the month is often referred to as “Uptober,” increasing expectations for a bullish trend.
Summary
September may be challenging for BTC historically, but investors are keeping hopes alive for October and the year-end. The Fed’s interest rate decisions and market dynamics will play a critical role in determining Bitcoin’s direction.
You can also freely share your thoughts and comments about the topic in the comment section. Additionally, don’t forget to follow us on our Telegram, YouTube, and Twitter channels for the latest news and updates.