

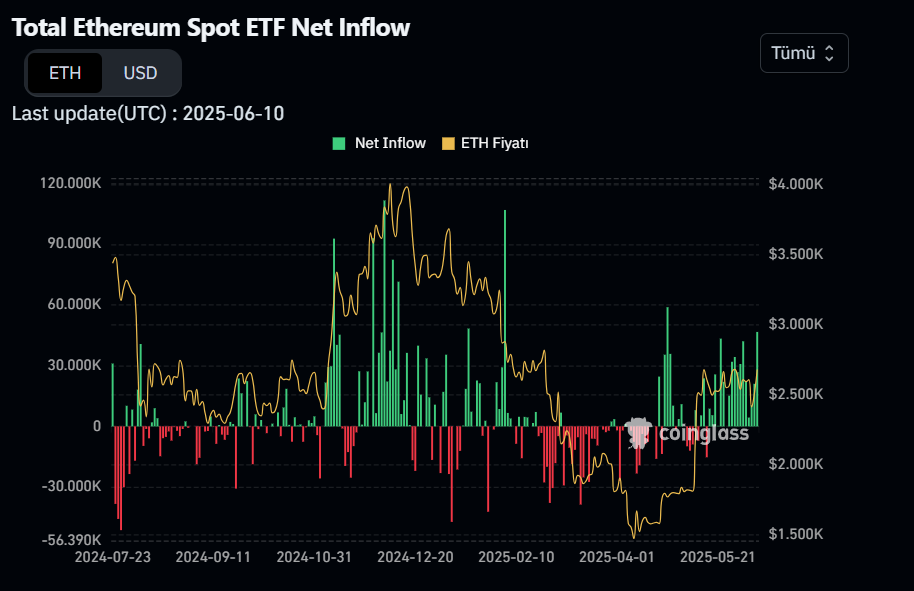
From May 16 to June 11, ETH ETFs experienced net capital inflows for 17 consecutive trading days. During this period, more than $837 million flowed into these ETFs.
On June 10 alone, a net inflow of $125 million was recorded. The largest contribution came from BlackRock’s ETHA ETF with $80.59 million. These purchases clearly indicate steady demand on the Ethereum ETF front. Although ETF investments currently have limited impact on Ether’s price, on-chain data suggests potential price pressure as most of these investments involve direct spot purchases. Additionally, there has been no net outflow during this entire period.
Institutional Demand Tightens ETH Supply
Alongside the ETF effect, Ethereum’s on-chain metrics point to a supply squeeze. The amount of Ether held in current exchange wallets dropped to 16.33 million ETH — the lowest level in history. Meanwhile, 28.3% of total ETH supply is staked. These data show that the majority of circulating supply is not readily sellable.
Although Ethereum network fees remain low, on-chain revenues have declined due to rollup-focused upgrades. In the last 30 days, the network generated only $43.3 million in revenue. Thus, concerns about network sustainability persist. However, “blob” upgrades reducing rollup data costs have accelerated growth in the Layer 2 ecosystem. For example, DEX transactions on networks like Base and Arbitrum have reached a total volume of $70 billion.
Ethereum Maintains Its Leadership
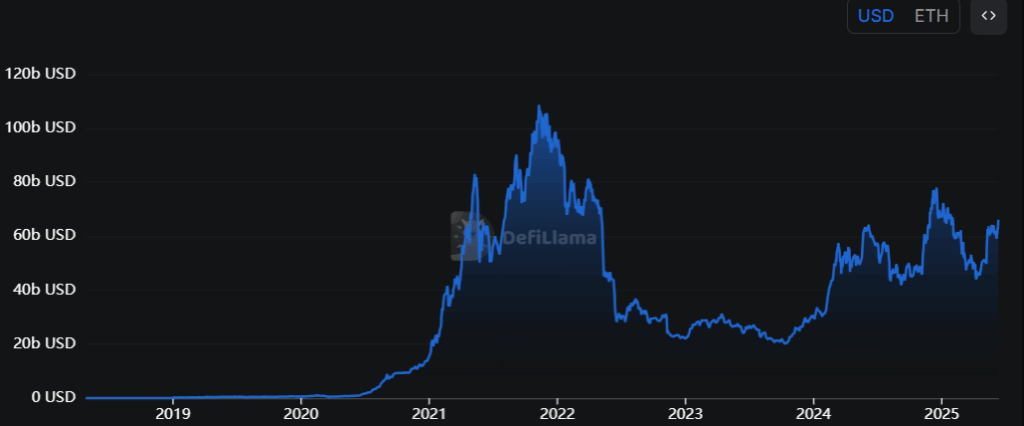
Ethereum’s base layer holds a total locked value (TVL) of $66.6 billion, significantly outpacing rival networks. Ethereum commands 61% market dominance based on TVL, while its closest competitors hold only 14% combined.
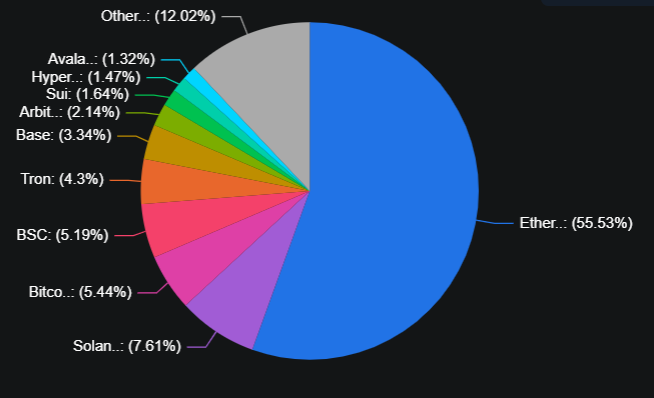
Pendle, Ethena, and Spark protocols have led TVL growth. During the same period, BNB Chain fell by 6% and Solana by 2%, indicating unsustainable deposits outside Ethereum. Between May 7 and 14, Ether’s price surged 48%. This rally, combined with increased demand, created an imbalance between current holders and potential buyers, raising the likelihood of breaking the $2,900 resistance soon.
The momentum Ethereum has gained on the ETF side continues. Supported by on-chain data, institutional buying keeps long-term price growth expectations alive. As exchange supply decreases, the amount of ETH locked through staking and ETFs steadily rises.
You can also freely share your thoughts and comments about the topic in the comment section. Additionally, don’t forget to follow us on our Telegram, YouTube, and Twitter channels for the latest news and updates.