

Some altcoins are currently stuck between key levels, waiting for a decisive move. The price action of certain coins suggests a potential breakout — or breakdown — could be near. For traders, now is a time to watch closely.
Price Consolidates in Narrow Range
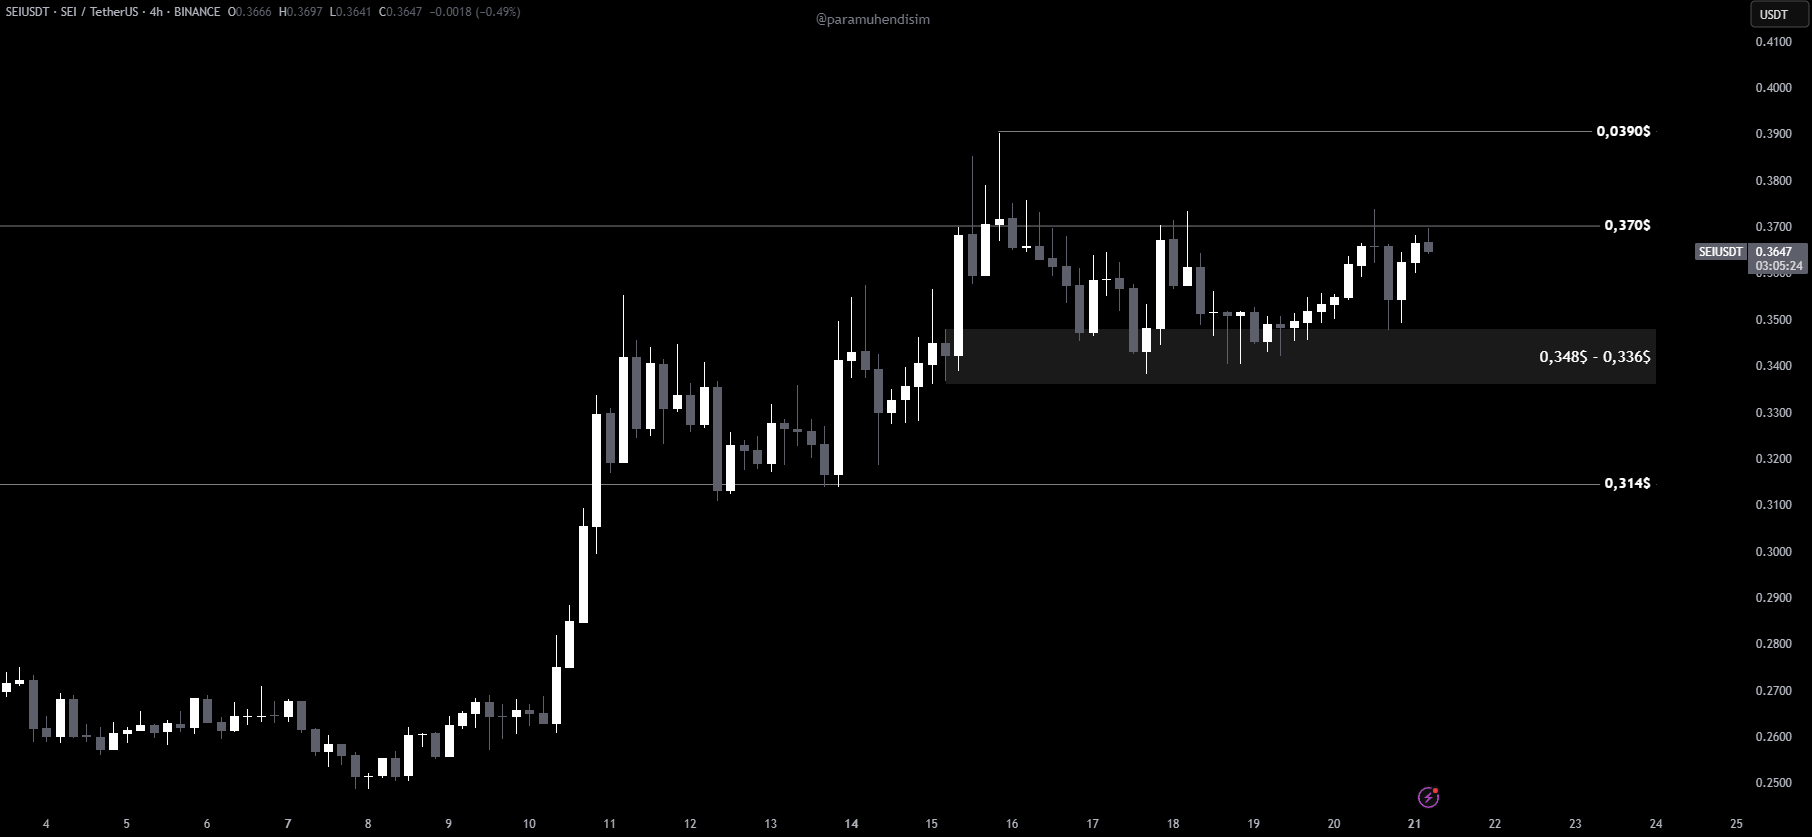
Sei is showing a clear squeeze between support and resistance on the 4-hour chart. The price has tested the $0.0370 resistance level but has not managed a convincing breakout yet. If a candle closes above this level, the next potential target lies at $0.0390.
You Might Be Interested In: Sonic SVM Research: Can New Stablecoins Shake Up the Old Order?
Rejection Could Trigger a Pullback
If rejection from the resistance zone intensifies, the possibility of a downside movement increases. In that case, the nearest support area to watch would be the $0.0348 – $0.0336 range. This zone could determine whether the price finds a new base to recover from.
Decision Time for Investors
The current technical structure highlights a crucial decision point for Sei investors. A confirmed breakout or breakdown from the current range may set the tone for the next significant move.
You can also freely share your thoughts and comments about the topic in the comment section. Additionally, don’t forget to follow us on our Telegram, YouTube, and Twitter channels for the latest news and updates.