


In times when the crypto market seems relatively quiet, some assets are quietly gearing up for their next major move. One such example is Ethereum, currently trading within a well-defined triangle pattern that has caught the attention of technical analysts.
These consolidation patterns often precede sharp breakouts, especially when price action nears critical support or resistance levels. Right now, Ethereum appears to be on the brink of such a breakout.
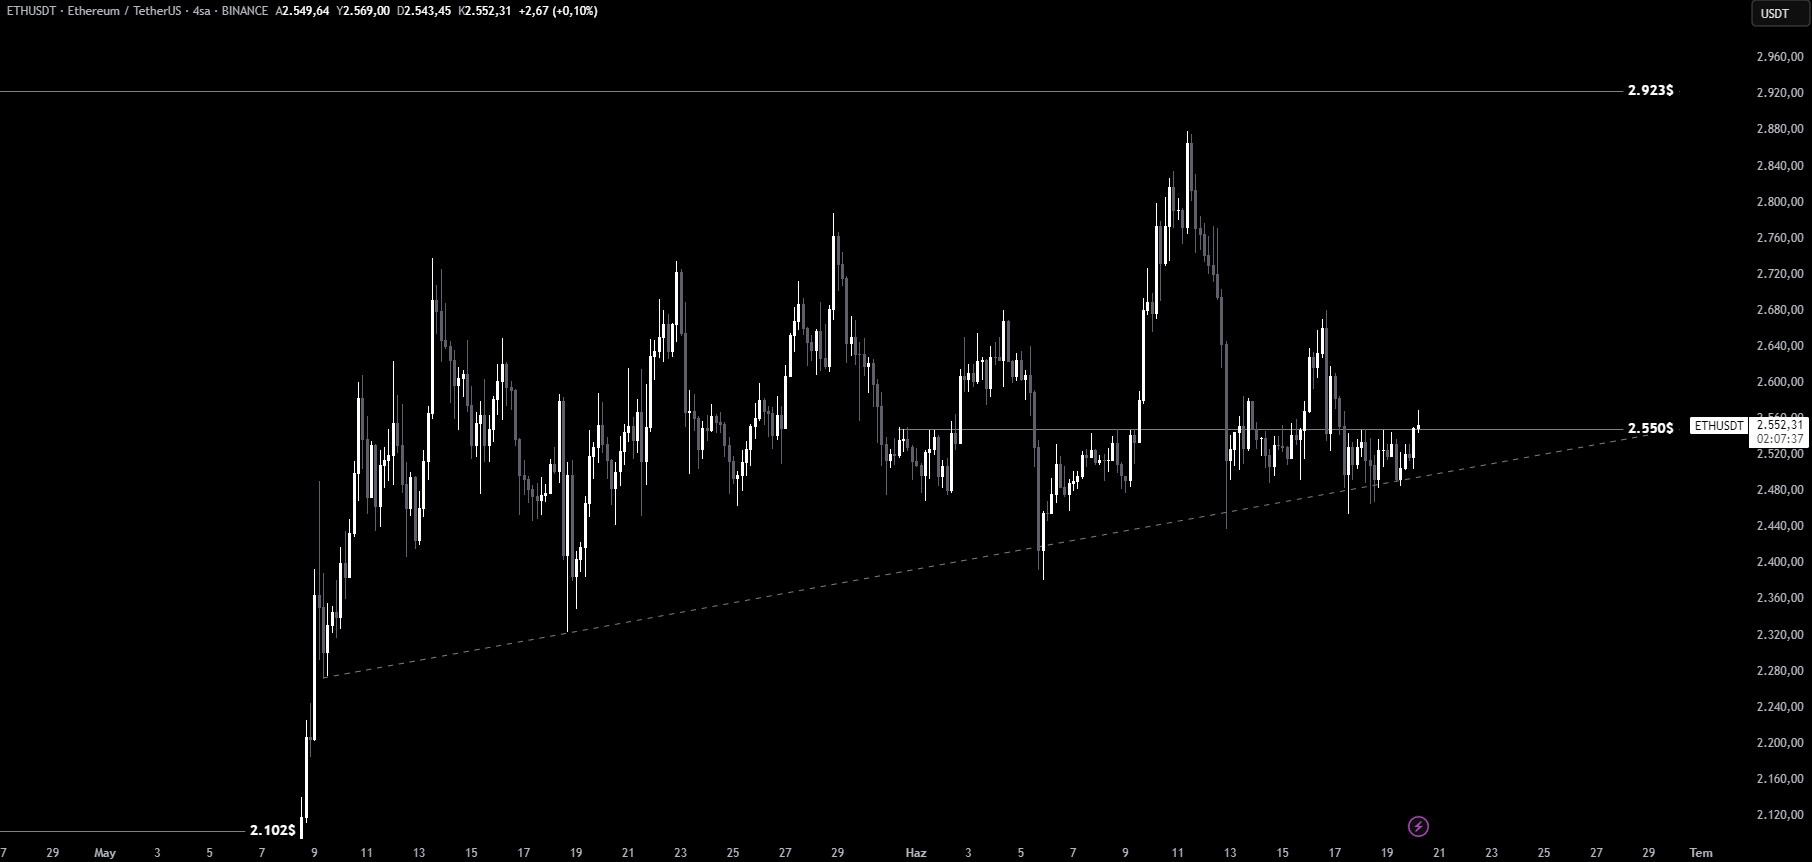
Key Resistance Under Pressure
The upper boundary of the triangle—marked around $2,550—is being tested. If we see a solid 4-hour candle close above this level with supporting volume, a move toward the $2,650 mark could follow swiftly. This would signal renewed momentum for the bulls.
You Might Be Interested In: Elon Musk Talks About the Name of a New Memecoin!
However, volume confirmation is essential. Without it, there’s a risk of a false breakout, potentially trapping over-leveraged traders.
Downside Risk Still Lingers
Conversely, if Ethereum breaks down from the lower end of the triangle, the price could swiftly retreat to the $2,350 level. Short-term traders should closely monitor their stop-loss placements to manage risk accordingly.
While the direction isn’t confirmed yet, the breakout is likely near. Traders would be wise to watch support and resistance levels closely.
You can also freely share your thoughts and comments about the topic in the comment section. Additionally, don’t forget to follow us on our Telegram, YouTube, and Twitter channels for the latest news and updates.